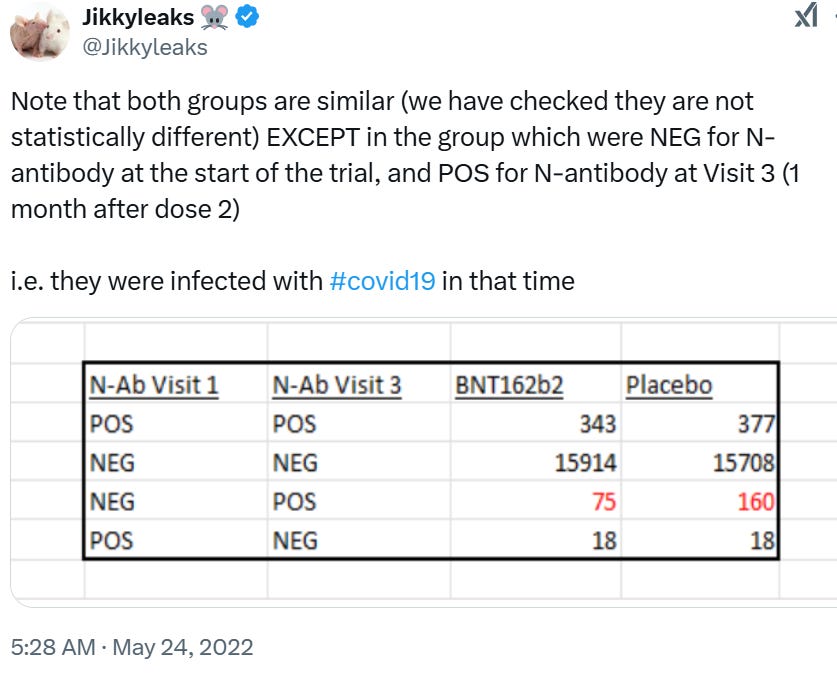
Pfizer's secret documents reveal that their COVID vaccine actually made you 8.7% more likely to get COVIDBuried in the documents that Pfizer wanted hidden from public view for 75 years there was a table that revealed that their vaccine actually had negative efficacy.Executive summaryPfizer tested all participants in their Phase 3 trial for N-antibodies. The results were kept hidden from the public. It was only through court order that we finally know what the results were. Do you think they would have kept this data secret from the public if it showed good news? Heck no! The table showed that Pfizer only had around 50% protection if you just take the table at face value. But if you interpret the table correctly, it shows Pfizer had negative efficacy. In this article, I’ll show you how to properly interpret that data and get the truth. The method was first disclosed by Jikkyleaks on May 24, 2022. I recently became aware of it after independently replicating his work. I believe his numbers are slightly off, so I’ll show you the proper calculation for the correct estimate of the case counts. No doubt about it; those who took the shots were more likely to be infected by COVID by 8.7%. There is just no other way to interpret the Pfizer data. It’s “gold standard” clinical trial data. The overall counts are too small for the result to be statistically significant. But the FDA should NEVER be approving a vaccine where the primary endpoint efficacy (reducing cases vs. the unvaccinated group) is so small to be statistically insignificant. In plain English, the best estimates are that there were actually more infections in the vaccine group than the placebo group. Whoops! This is a major failing of the FDA to recognize this. It won’t be long before Senator Ron Johnson brings this to their attention. Here’s how you show that the Pfizer data means the vaccine had negative efficacyPfizer documents that were required to be disclosed under court order: They tested everyone in both cohorts and found that 160 unvaxxed developed N-antibodies vs. 75 vaxxed: Ratio: 2.1x. That means that at best, the vaccine only reduced virus infections by slightly more than 50%. The 95% efficacy was clearly false. But it wasn’t even 50% efficacy! If you got the shots, you’re less likely to develop N-antibodies when infected. It’s right there in this paper, co-authored by NIH and Moderna. NIH/Moderna paper: They looked at 700 people who had a confirmed COVID infection, 93% of unvaxxed developed N antibodies; but only 40% of vaxxed developed N-antibodies. So the infections in vaccinated were “undercounted” if you just relied on the N-antibodies which is by far the best measure of whether you got a COVID infection after the start of the RCT (since everyone in the trial was tested both before and after they got their jabs). Now let’s do the math to estimate the ACTUAL number infected in each cohort unvaxxed = 160 /.93 = 172 infected Vaxxed 75/.4 =187 infected So now we know. The vaccine made you 8.7% more likely to be infected in the 6 month trial. This is why they concealed this data from the public. And since the CFR went up by 9% as well for 1 year post vaccine rollout, we should be able to ascribe approximately 17% of the total COVID deaths as being directly caused by the vaccine based on the RCT. Estimating the damage tollSo let’s tally up the deaths caused by the vaccine. 3 per thousand vaccinated died from jab related conditions: 800K lives 17% increase in the COVID death toll on 720K deaths = 122K lives So almost 1M lives lost in just the first 2 years from the shots. SummaryIt will be great to see the FDA’s calculation on this data. We’ll finally get to see it with Senator Ron Johnson asking them to produce it. You're currently a free subscriber to Steve Kirsch's newsletter. For the full experience, upgrade your subscription. |


No comments:
Post a Comment