Top-Down Investigation Bottom-Up Quantification Method (TBM)Epidemiological & Public Health Vigilance System[Fourth article in a series. 1) Leadership, Management, and Strategic Planning in the Covid Era, 2) The Ineffective Messaging of “Myocarditis in Young, Male Athletes”, 3) Sudden Kidney Failure Began with Government Incentives, not with COVID, 4) Top-Down Investigation, Bottom-Up Quantification Method for Epidemiological Vigilance, 5) Differences in Pneumonia, COVID, and All-Cause Death Profiles by Age Group.] The first article in the series called for better leadership and messaging in the health freedom movement. The second article detailed the magnitude of myocarditis versus kidney failure and which should get more visibility. The third article explained that sudden kidney failure excess deaths began when COVID treatments and “vaccines” began and not when COVID disease began. The recommendation was to conduct a detailed forensic investigation in order to conclusively determine the causes of excess deaths. This fourth article provides a project plan for forensic investigation and quantification to determine the cause and quantity of negative health occurrences. Nothing in the plan proposed in this article is new to engineering, though it may be new to epidemiology. The implementation is cheap, easy, necessary, and fits the express missions of state and federal government health agencies. Any good engineer would characterize this plan by the colloquialism, “It’s a no-brainer.” IssueThe Communicable Disease Center (CDC) opened on July 1, 1946 with the primary mission of preventing malaria from spreading across the United States.¹ In 2025, the current U.S. Centers for Disease Control and Prevention (CDC) agency expresses the following mission, “… to protect America from health, safety and security threats … fights disease and supports communities and citizens … increases the health security of our nation … saves lives and protects people from health threats … conducts critical science and provides health information that protects our nation …”² Agents of the CDC have not acted in accordance with their express public mission statement. In fact, they have acted adversely to their mission statement since at least 2020 and likely for many decades before that. Rather than continue negative commentary listing all the criminal acts committed by agents of three-letter agencies (TLAs) intending to harm The People, a short one-page purpose statement is offered followed by a cursory 11-page project plan to do the job they should have been doing since their inceptions. MISSION
OBJECTIVES
ISSUES
In research papers, confidence intervals and p-values are used to draw inferences about a larger actual population for which the data is unavailable to the researcher. These inferences are often wildly incorrect due to confounding variables, lack of controls, polymodal distribution functions, and paradoxes in data. SOLUTIONS Utilize all of the pertinent government data. In order to determine causality, investigate from the high-level abstract data down to the low-level particularized individual records. Then quantify the dead and maimed by mathematically operating on data aggregated by cause-of-death, age, and other variables. IMPLEMENTATION Adopt the Top-Down Investigation, Bottom-Up Quantification Method (TBM) and develop the sub-process Automated Learning in Public Health Analysis (ALPHA), both centered on the public health mission. ALPHA is an early warning system and an hierarchical forensic investigation tool. The CDC, FDA, and NIH have not shown that they have anything close to the utility of the TBM. EBM is not a project plan. It is simply a rigid framework for scientific study. TBM is a project plan that determines causality and then quantifies deaths from externalities such as pathogens that enter a locale. TBM borrows from electrical engineering (EE) workflows and solves the deficiencies of EBM. The EE workflow, “Top-Down Design, Bottom-Up Verification,” evolved to meet the business challenges of billions of transistors switching billions of times per second costing millions of dollars per prototype run. ALPHA utilizes more EE methods such as Monte Carlo analysis. The availability of compute resources is vast, while cost is mere. There is no reason to omit Monte Carlo sweeps on all available government data. NOTE: Early TBM and ALPHA prototypes were used to generate world-leading Covid and vaccine findings years before EBM-style research papers found the same evidence. Future access to immunization registry databases will greatly improve TBM results. In one man-week, all vaccine debate can end. Government blockade of the immunization registry is a dereliction of a legal duty to act for the safety of The People. InvitationState and federal health agencies are welcome to contact Summa Logica LLC, John Beaudoin, Sr., to discuss strategy, tactics, or details of the plan. Nuanced organizational behavior and management techniques of the plan are not intuitive. Thus, government implementation without consultation from Summa Logica LLC is less likely to succeed. An open offer is on the table to perform the work under NDA, in government offices, on the government network. This would allay all privacy issues. The government then has no excuse to withhold government health data. Government citation of HIPAA or other laws would only the pharmaceutical industry from The People attaining the TRUTH at the expense of mass deaths among The People. The TBM MethodIt is critical for the researcher to understand that the objective is to determine cause and then quantify those affected. The investigation process from the top-level data abstraction of All-Cause deaths down to the thousands of pages in an individual case file is to establish causation, and not necessarily to learn the mechanism of action at the cellular or molecular level. The Top-Down Investigation, Bottom-Up Quantification Method (TBM) is not a science experiment. EBM and the scientific method are only incidental to the mission to Make America Healthy Again, Free, and Great Again. TBM is a workflow project plan to achieve an objective, not prove an hypothesis. Know the difference. If a researcher discovers stark increases in specific causes-of-death, he is tempted to rely on the numbers as proof of causality between a medication or procedure and the cause-of-death. This cannot be proof. Variables are unknown. The Top-Down Investigation half of the flow is not complete until individual medical records are reviewed by professional clinicians such as physicians, medical examiners, or other experts. The sampling of individual records is crucial to achieve conclusive evidence of causation. Only after causation is established can Bottom-Up Quantification results be firmly stated in public communications. Both halves of TBM can be performed in parallel. The latter does not rely on the former. My point here is that emphatic statements about the quantity of people who died from a disease or medication cannot be substantiated or believed unless the causal trace has been completed to the record-level forensic inspection. Top-Down Investigation
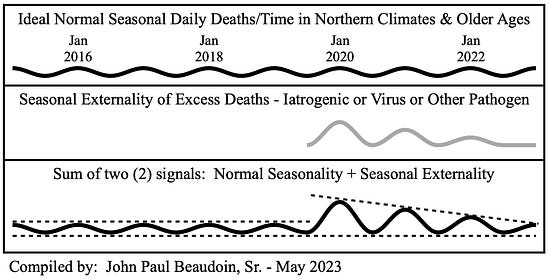
Figure 1Figure 1 is Figure 19.1 from The Real CdC (Beaudoin, 2024). Three diminishing waves of a seasonal respiratory virus-like illness (gray plot) entered this ideal seasonal society (top black line plot) and resulted in the lowest of the three plots representing total deaths. Notice the return to baseline in the summers even during the externality. If pneumonia deaths result from a new seasonal virus, then the resultant plot should look like the bottom plot in Figure 1. One important thing to consider is that if the first wave enters late in a season, then the first wave may be less than the second wave. All waves after the second wave should be smaller in each successive season.
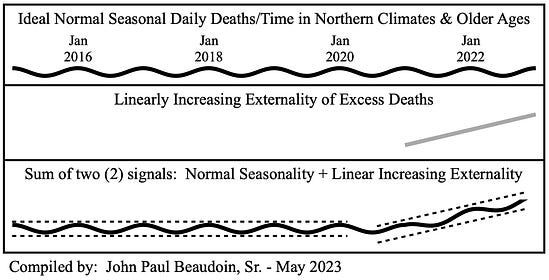
Figure 2Figure 2 is Figure 19.3 from The Real CdC (Beaudoin, 2024). In this case, an externality (gray line plot) enters society and increases linearly similar to what a “vaccine” rollout might look like. The bottom plot depicts the total deaths resultant from such a linear externality.
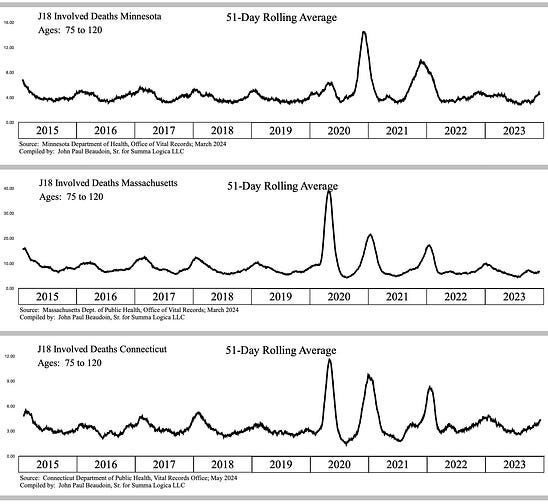
Figure 3Figure 3 depicts the actual “pneumonia, unspecified” involved deaths from three (3) states, Minnesota (MN) at top, Massachusetts (MA) middle, and Connecticut (CT) at bottom for ages 75 and older. All three (3) states clearly show a seasonal externality entering late in the season in 2020 end of winter, beginning of spring. Notice that all return to baseline or below baseline every summer. Also notice that MN’s first wave is very small compared to MA and CT. Thus, MN’s second wave is the largest. And all three (3) states’ third waves are smaller than second waves. One would expect the same graphs to result in younger ages.
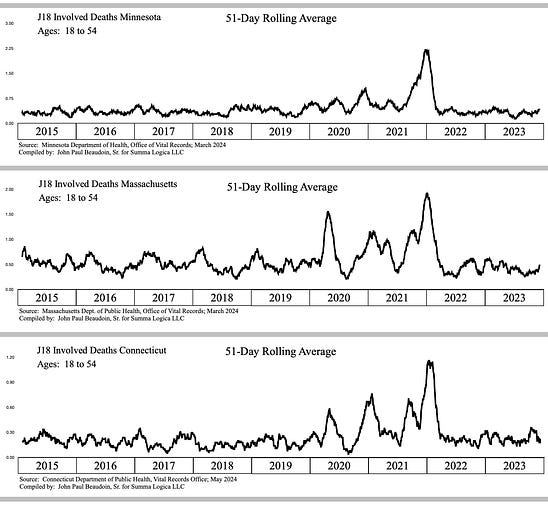
Figure 4Figure 4 depicts “J18” pneumonia for ages 18-54. The expected observations are that summer 2020 returned to baseline and that there appears to be a seasonal aspect to all three (3) states. However, there is a significant issue in the amplitudes. The all get much larger from the second to the third waves. Why would more people ages 18-54 die involving pneumonia in the third wave than in the first or second waves? No disease in history kills more the third time around. It’s as if people ages 18-54 did something to their bodies to make them more susceptible of dying from pneumonia. At this point, one would flag this as a health emergency and proceed to steps E. and F. to perform forensic investigations in detail for samples of previously young, healthy people who died from pneumonia. What medications were they given in hospital? What vaccinations or gene drug therapies did they receive and when? Omission of such an investigation is a criminal omission of required legal duty.
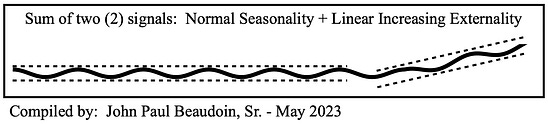
Figure 5Figure 5 is a reminder of a linearly increasing externality where the troughs rise. Imagine two externalities that combine.
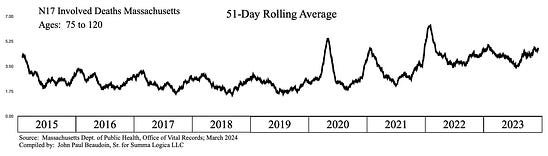
Figure 6Figure 6 depicts deaths involving “N17” “Acute renal failure” in ages 75+. The graph is obviously a combination of a linearly increasing signal due to troughs rising in time and seasonal signal of winters rising and falling.
A year of Massachusetts death records contains ~ 60,000 records. The purpose of data analyses and anomaly searches in the Top-Down Investigation phase of TBM is to reduce the locus of examination to a plausibly investigable quantity. Imagine ~60,000 records pared down to 300 records that are the most likely to conclusively yield causal attribution of death to a medication or procedure. Ten (10) experts can forensically review 300 case files in detail in a reasonable time period (a few weeks). A record-level forensic inspection must be performed by experts to ascertain causality to an acceptable and court-ready standard of proof. (A more detailed representation of this section would manifest a three hundred (300) page manual. This is a mere cursory overview.)
Seek, obtain, and forensically analyze the detailed hospital and emergency response records of those who appear otherwise healthy and who died or were injured by an unexpected cause, for example, thrombocytopenia, pulmonary embolism, cardiac arrhythmia, sudden kidney failure, aortic dissection, GI ischemia, or stroke. Begin in the 18-44 age range, then subsequently pursue records from older age groups in five (5) year increments until causation is evinced beyond reasonable doubt in a substantial number of records.
Bottom-Up Quantification Much of the work of quantification may already have been done through the Monte Carlo sweeps performed during the Top-Down Investigation phase. Using various model calculations for excess deaths based on actual minus expected deaths, provide reports of quantification across pertinent variables. The quantities can now be justified based on the causal traceability established in the expert case file reviews of the Top-Down Investigation phase of TBM. Record-Level Source Data (RLSD) allows multi-variable analyses such as COVID AND Pneumonia compared to COVID NOT Pneumonia or compared to Pneumonia NOT COVID. This aids in quantification. Concluding RemarksEpidemiology seems to rely almost exclusively on EBM for methodology and inferential statistical methods (ISM) for modeling. Epidemiologists, including many doctors who take a class in epidemiology, self-describe as “scientists.” ISM modeling and EBM methods they call “science” are not symbiotic with real world project planning and real time project execution to achieve successful disease investigation and quantification. “Public health" requires strategic plans for disease response and vigilance. TBM is a project planning methodology for public health response and vigilance. TBM utilizes far more modeling techniques than ISM. If the objective is to determine causality and quantify those affected by the cause, then EBM and ISM fall short of that mark. Poor methodology and modeling are the likely reasons that the vaccine debate lingers after more than a century of research and publication. TBM can solve that debate in a week. One example of incorrect modeling and methodology is the use of randomized controlled trials (RCT) and peer reviewed research papers to determine everything. If all you have is a hammer, everything looks like a nail. For example, hubris was on display in the use of RCT and peer review to determine mask effectiveness. Before performing RCTs with dozens of confounding variables, ask an engineer. The question is easily answered by engineers who develop the specifications for masks, design the masks, develop the manufacturing process for the masks, and develop the quality assurance test fixtures for the masks. Doctors might read the spec on the box before donning. Or ask a surgeon the tensile strength of his new scalpel. He can only tell you how it feels in his hand and if it bends upon cutting into ligaments, cartilage, or bone. Each expert should stay in their lane and doctors have no useful opinion about masks better than a drywall and plaster contractor. The TBM methodology laid out herein was prototyped via the work on Massachusetts, Minnesota, and Connecticut death records databases. Unique insights and findings no one else in the world found are in publications from Summa Logica LLC. Peer-reviewed research papers into Covid-19 and vaccine issues have been one (1) to two (2) years behind the results provided by the TBM methodology. The TBM methodology produced new visualizations of anomalies likely caused by serious adverse externalities. For example, Time-Window Shifting, Prevalence-of-Cause, and Simpson’s paradoxes found anomalies that no other researcher in the world found. TBM found massive numbers of excess Acute Renal Failure involved deaths back in the middle of 2022. TBM also showed back in mid-2022 that lymph node cancer and bone marrow cancer were excessive and climbing. Lymph node cancer in Massachusetts was ~400% of normal in 2023. TBM also showed in mid-2022 that, in Massachusetts, greater excess deaths in 2020 involved respiratory ICD-10 codes, while greater excess deaths involving clotting and bleeding occurred in 2021. Again, a disease does not change how it kills on a year boundary. The societal profile of causes-of-death changed starkly upon introduction of a new technology gene therapy drug rebranded as a “vaccine.” In addition to offering new techniques in finding data paradoxes, new visualizations to determine timing of anomalies, new profiles of seasonality in waveforms using time and frequency domain analyses, new methods of age profiling excess deaths, and other world firsts in epidemiological findings, TBM provides insight into the behavioral aspects of records including fraud detection, custom and practice change detection, and other effects on data integrity. Most importantly, TBM produces a path to find the best records for deep inspection, which yields important answers derived from evidence such as vaccine dates from VAERS reports and Medicare/Medicaid reports, number days since vaccination, express statements by medical examiners that the vaccine is a cause-of-death, and medical files that contain times of medications, blood anomalies, and other diagnostics. There is no method in the world that comes close to TBM. One engineer produced more accurate and ground-breaking findings than hundreds of thousands of public health employees and PhD epidemiologists around the world. EBM and ISM cannot prove anything conclusively. However, TBM, using RLSD investigation, can conclusively determine causality and quantify those affected. Adopt TBM. The People will then have an answer for the TRUTH of “safe and effective” in one man-week and a methodological pathway for “public health” that will last ages. RisksThe greatest risk in deploying TBM is that a government somewhere may use it against The People as a means to create a false alarm in society — to create fear to control society. Transparency is the answer to alleviate such risk. Probably the most difficult thing to believe is that one person, with good friends and support in the research community, found all these new epidemiological methods and discoveries. There is a great risk that TBM may sound too good to be true. TBM is real and has been proven effective. TBM should have been implemented decades ago. The risk is that ONE MILLION AMERICANS MURDERED BY GOVERNMENT RECOMMENDATIONS will be discovered by many in the future and they will absolutely attribute this holocaust mass murder to whomever was in government at the time. All will be revealed. I recommend that “they” fix it or be affixed with it, forever in the history of the world and in the life everlasting. References1 (2023 April 19). Our History — Our Story. David J. Sencer CDC Museum: In Association with the Smithsonian Institution. Found at https://www.cdc.gov/museum/history/our-story.html# on 2025 January 15. 2 (2024 January 26). CDC’s Mission. Mission and Org Charts. About CDC. Found at https://www.cdc.gov/about/divisions-offices/index.html on 2025 January 15. Beaudoin, J. (2024). The Real CdC: COVID FACTS FOR REGULAR PEOPLE. Summa Logica LLC, Winchester, New Hampshire. Available at TheRealCdC.com. Beaudoin, J. (2024). THE CDC MEMORANDUM: NOTICE OF CRIMINAL LIABILITY. Summa Logica LLC, Winchester, New Hampshire. Available at TheRealCdC.com. Beaudoin, J. (2024). THE CONNECTICUT MEMORANDA SERIES - NOTICE OF HOSPITAL HOMICIDES & ACUTE RENAL FAILURE DEATHS Vol. I. Summa Logica LLC, Winchester, New Hampshire. Available upon request from author. Beaudoin, J. (2024). THE CONNECTICUT MEMORANDA SERIES Volume II - COVID-19 “VACCINE”-CAUSED DEATHS & DEATHS FRAUDULENTLY LABELED “COVID-19”. Summa Logica LLC, Winchester, New Hampshire. Available upon request from author. Regards, John Paul Beaudoin, Sr. President & CEO Summa Logica LLC You're currently a free subscriber to The Real CdC’s Newsletter. For the full experience, upgrade your subscription.
|
No comments:
Post a Comment