CDC Disinforms ACIP Regularly
Remember when Dr. Sarah Meyer testified in June 2025 that CDC only knew of 6 TTS deaths and only from Janssen?
Dr. Sarah Meyer of the CDC testified before the Advisory Committee on Immunization Practices on June 25, 2025.
In that meeting, she stated that the CDC monitors all the VAERS and death databases and found no signals of excess deaths except the 6 TTS (thrombosis with thrombocytopenia syndrome) deaths from the Janssen Biotech vaccine — the one paused for only 10 days and then restarted for the rest of 2021. Then they said they preferred people use modRNA Covid vaccines. They did all that while people were dying en masse from thrombocytopenia across the United States.
Having a few moments for a respite, I dove into CDC Wonder. I sought to support what I said in the recent October 22, 2025 Joint Committee hearing in Massachusetts, which was that there are 10,000 excess thrombocytopenia involved deaths in USA since the Covid vaccines and 30,000 excess pulmonary deaths.
Figure 1 depicts total deaths in USA for years 2010 through 2024 involving ICD-10 Code prefix “D69,” which includes, “Allergic purpura; Qualitative platelet defects; Other nonthrombocytopenic purpura; Idiopathic thrombocytopenic purpura; Other primary thrombocytopenia; Secondary thrombocytopenia; Thrombocytopenia, unspecified; Other specified haemorrhagic conditions; Haemorrhagic condition, unspecified.” (thrombocytopenia dominates this code set in quantity)
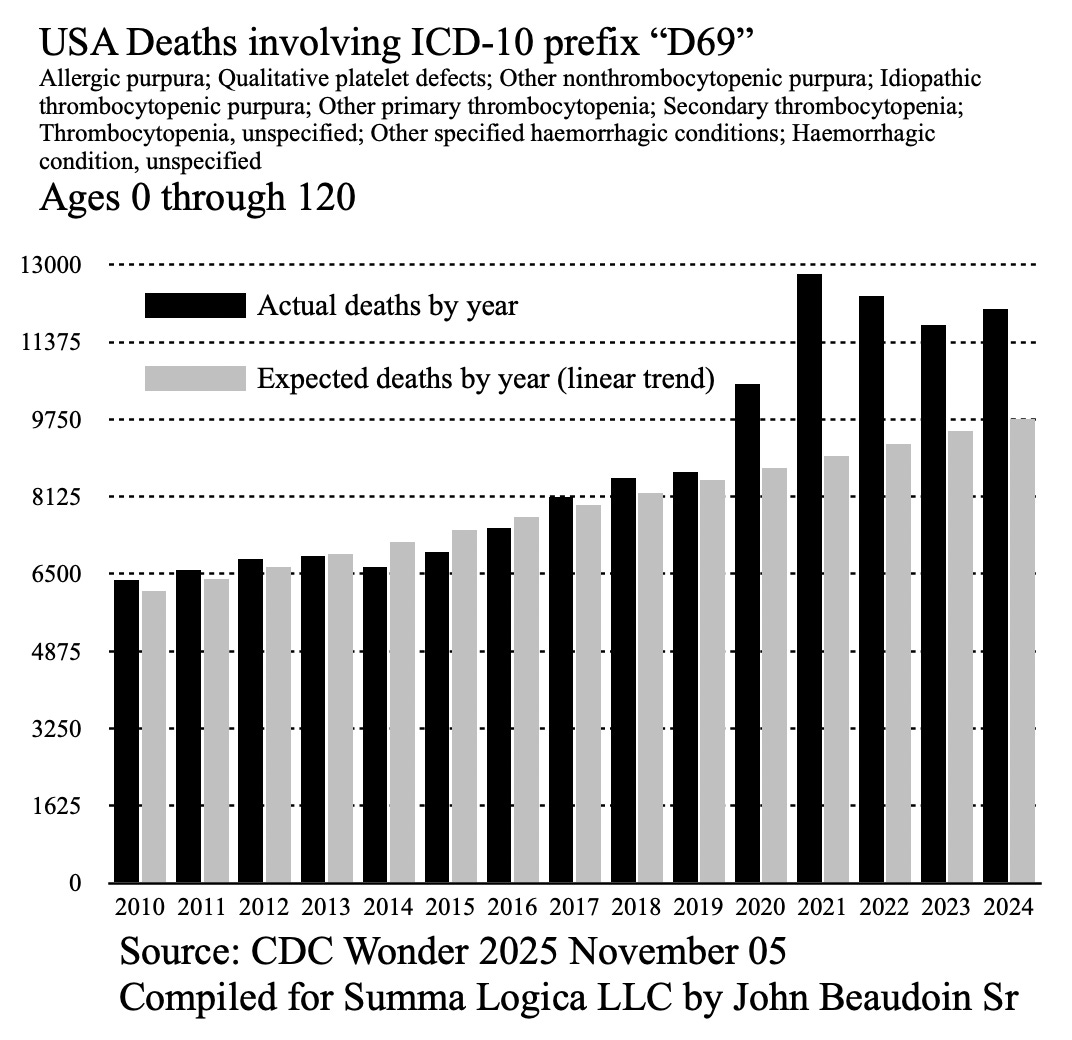 |
Figure 1
I like to use raw numbers because the human brain is a pretty good pattern detector and also because the regular public can relate to it and see the gross anomalies.
Year 2020 was anomalous, but not nearly as much as 2021 and after. Figure 1 gray bars use a linear trend method of least squares approximation and base years 2010-2019 to develop the trend line. It creates a good visual comparison of what should have been.
Figure 2 depicts the excess above and below the trend.
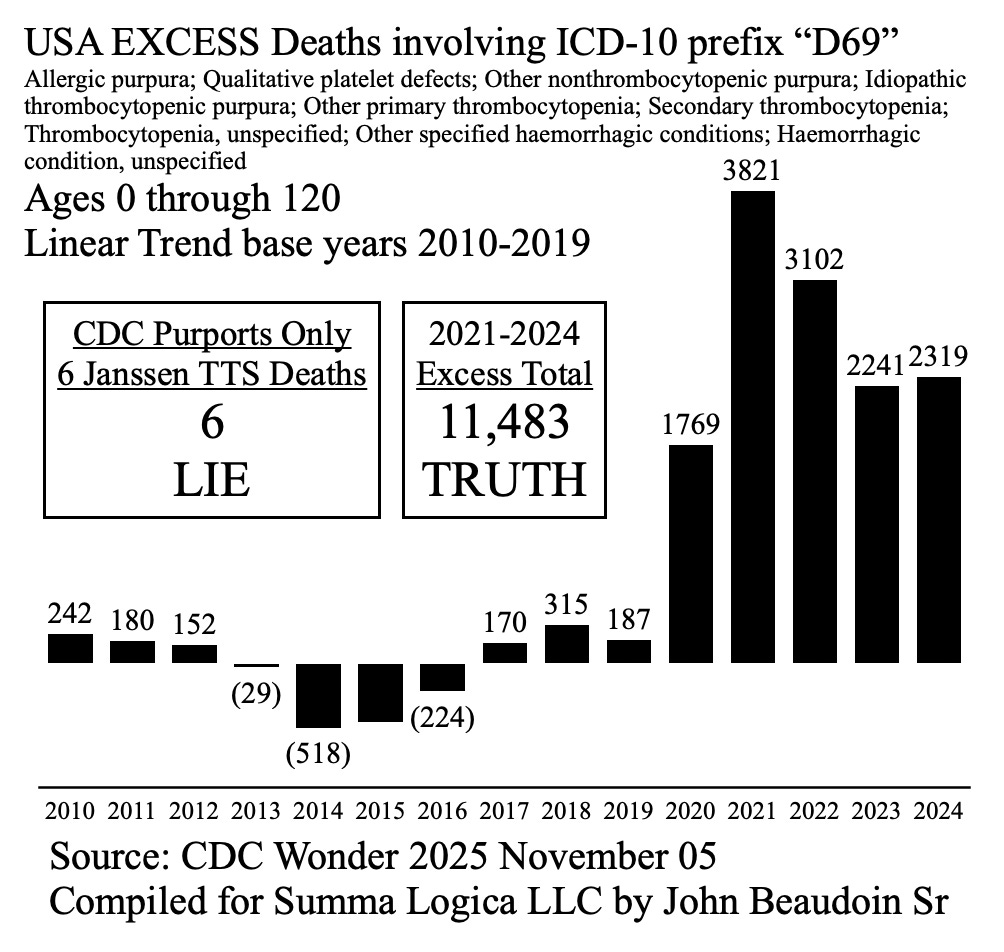 |
Figure 2
Notice in Figure 2 the excess total of 11,438 (greater than the 10,000 I stated in the hearing).
Consider also the testimony of Dr. Sarah Meyer. How can the CDC miss such a stark signal and say they only know about 6 Janssen TTS deaths? They must think that the public is stupid or does not care or that the media will just not cover the story.
Turning to the issue of 2020, please refer to my article regarding Prevalence-of-Cause (PoC). In order to determine if there is excess in a given cause, it is important to adjust for a large number of excess all-cause deaths. If there is a rise of 20% in all-cause deaths in a period of time due to disease Z, and Z purportedly causes thrombocytopenia, then the percentage of thrombocytopenia involvement in all-cause deaths should be higher than its percentage baseline involvement in deaths before disease Z.
For example, let’s look at the actual PoC graph for “D69 for USA to match the raw data in Figure 1.
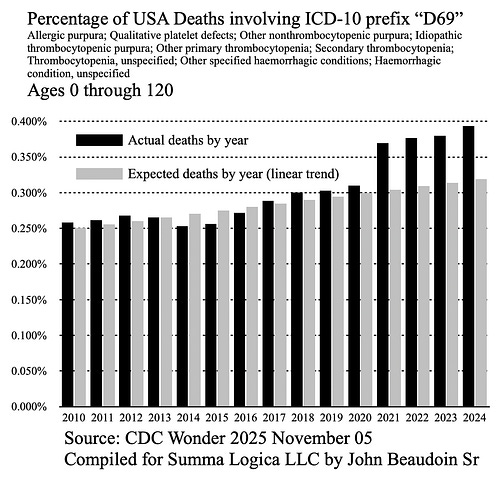 |
Figure 3
Notice in Figure 3 that the year 2020 is no longer anomalous. When did excess thrombocytopenia begin happening and what caused it?
The errant answer from Figure 1 is that Covid caused it because the excess began in 2020 before the Covid vaccines. However, if D69 thrombocytopenia was caused by Covid, then the excess should be higher as a percentage of overall deaths. Figure 3 shows that year 2020 is NOT much greater than expected. In fact, it’s in line with 2018 and 2019.
The signal of excess disappears from 2020 when adjusting for all-cause excess deaths that carry with them many causes in the data.
This is a paradox solved by method of PoC (Prevalence-of-Cause) analysis.
The methods employed by doctors and scientists in most research papers involve normal distribution, mean, standard deviation, and Z scores (number of standard deviations from mean). This method falls short of realizing the prevalence of anomalies and how to attribute them. The PoC method clarifies signals using simple math.
Figure 4 is the Z Score graph for raw data of D69 Thrombocytopenia.
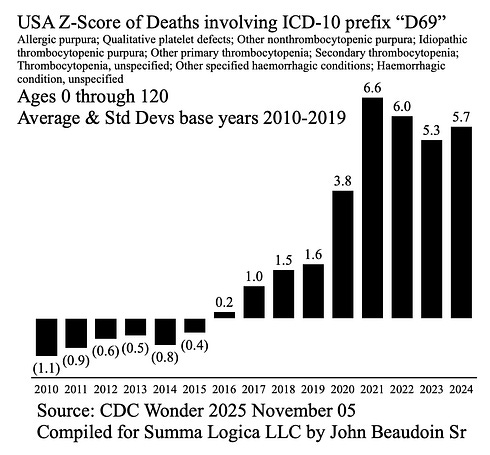 |
Figure 4
Figures 5 and 6 look at the Trend and Z Score graphs using the PoC dataset (post-all-cause excess adjustment, id est, percentage of all-cause).
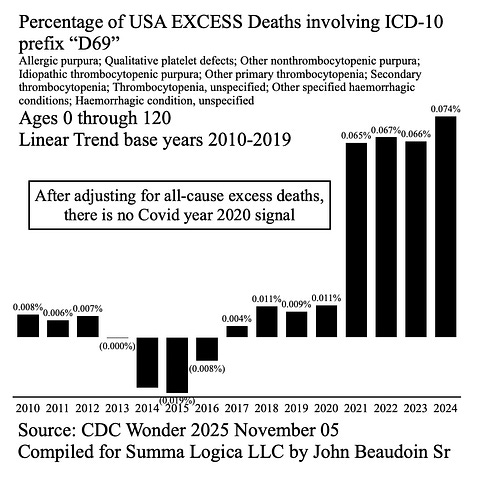 |
Figure 5
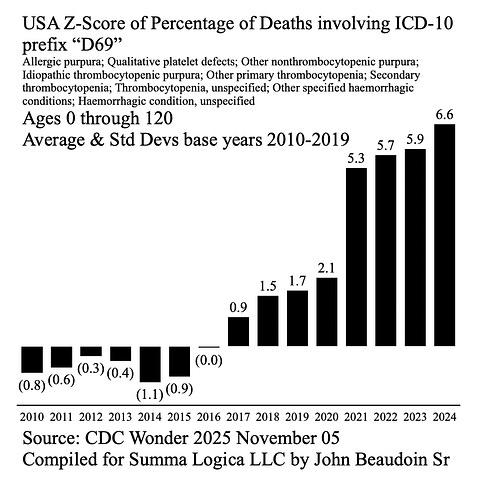 |
Figure 6
Figures 5 & 6 depict again that there is no signal in 2020 for D69 Thrombocytopenia.
Figures 7,8 & 9 depict PoC for Ages 0-64 D69 Thrombocytopenia involved deaths.
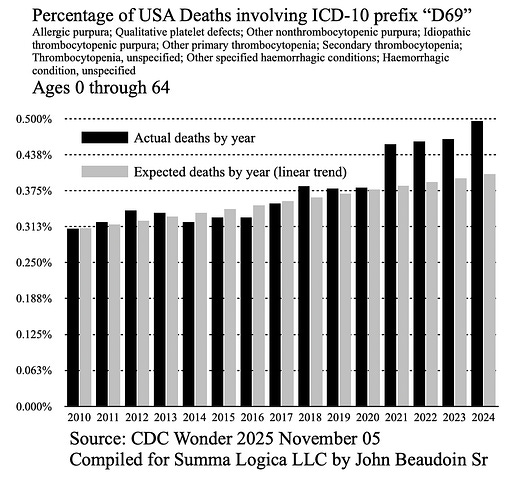 |
Figure 7
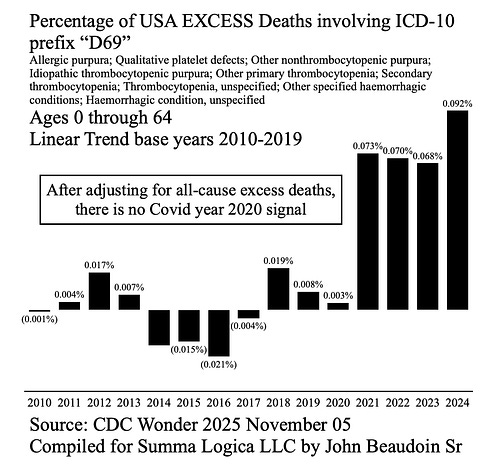 |
Figure 8
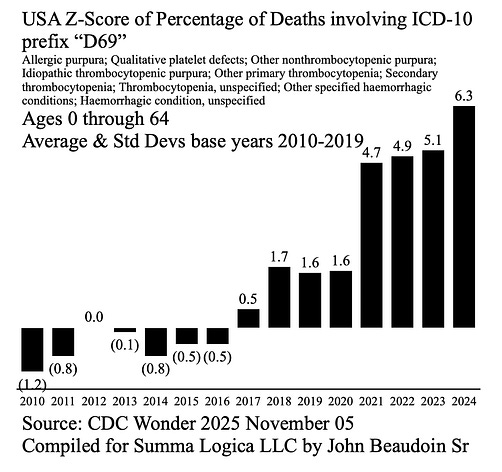 |
Figure 9
Res ipsa loquitur (the thing speaks for itself).
Figures 7,8 & 9 clearly show that 2020 was NOT the year that excess thrombocytopenia occurred. So when the research papers funded by the National Institutes of Health (NIH) are published, remember that they are all con artists trying to confuse the public to take the very poison that killed all these people.
Next is pulmonary embolism. Again, I believe that Covid disease per se does cause thrombocytopenia and pulmonary emboli deaths. However, the signal of the disease causing these blood issues is an order of magnitude or two less than the Covid vaccine. That’s why the signal shows so strongly when the Covid vaccines began.
God Bless you all
JOHN 14:6 TRUTH
You're currently a free subscriber to The Real CdC’s Newsletter. For the full experience, upgrade your subscription.
No comments:
Post a Comment