A closer look at the Czech data confirms the mRNA vaccines are too deadly to be used
Several people have replicated my work and agree with me. I'll list here the new attacks and why they all fail to explain the data so you can decide for yourself who to believe.
Executive summary
In an earlier article (which has links to all the Czech Republic articles I’ve written), I showed that gold-standard record-level data (showed the mortality rate ratio (MRR) between Moderna mortality rate and Pfizer’s was often over 30% and disproportionately impacted younger people. What this means is Moderna is too unsafe to be used. And other data shows Pfizer must be unsafe as well.
Since then, others have replicated my work showing both mRNA vaccines are too deadly to be used.
Using Czech data alone, we don’t have 100% proof that all the COVID vaccines were deadly. The findings could possibly be attributed to unknown confounders from an uneven distribution e.g. due to differences in socioeconomic status (SES). One product could be accidentally given to the sick and those more likely to die.
However, a thorough analysis of the Czech data shows why these explanations are very highly unlikely and why they are insufficient to explain the data that was observed. But critically there are many other data sources we can also use to build a full picture and greatly increase the confidence in our hypothesis.
Taking everything into account, there is simply no other remotely plausible explanation to explain what this gold-standard official government data shows. It’s devastating to the narrative for this reason.
Three key points:
None of the attacks provided a credible alternative hypothesis.
None of the attacks could point out anything in the Czech data that would preclude the vaccines from being deadly.
None of the attackers can explain a simple 100% verifiable anecdote like Jay Bonnar’s story. Within 2.5 years post vaccine rollout, Jay lost 15 friends unexpectedly, all vaccinated and 4 died on the same day as their vaccines (and 3 of the 4 were 30 years old or younger). He lost just one friend from COVID. This anecdote is statistically impossible if the Pfizer vaccine is safe (probability of around 5.63e-22). Nobody has ever explained how this story could have happened if the COVID vaccines are safe.
In this article I will:
List people who independently confirmed what I found
List the new attack vectors and explain in detail why each attack fails
Explain the techniques that people use to deal with the cognitive dissonance when they are confronted with data showing they are wrong.
This is a long article, but it’s important to address all the criticisms head on.
There is no viable alternative explanation
All of the attacks that have surfaced to date provide no plausible explanation for the observed data. They are all designed to create FUD. None provide an alternative explanation for the Czech data that is consistent with “safe and effective.” That should be very troubling for anyone supporting the narrative.
The data is too consistent and there was no brand specific systematic bias in vaccine distribution in the Czech Republic.
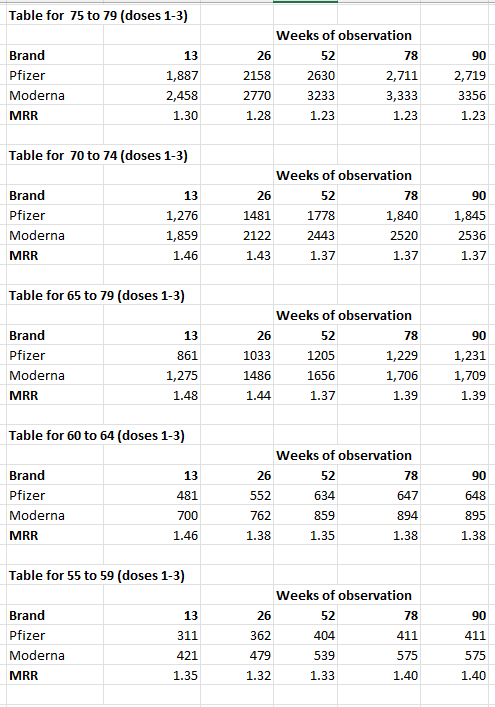
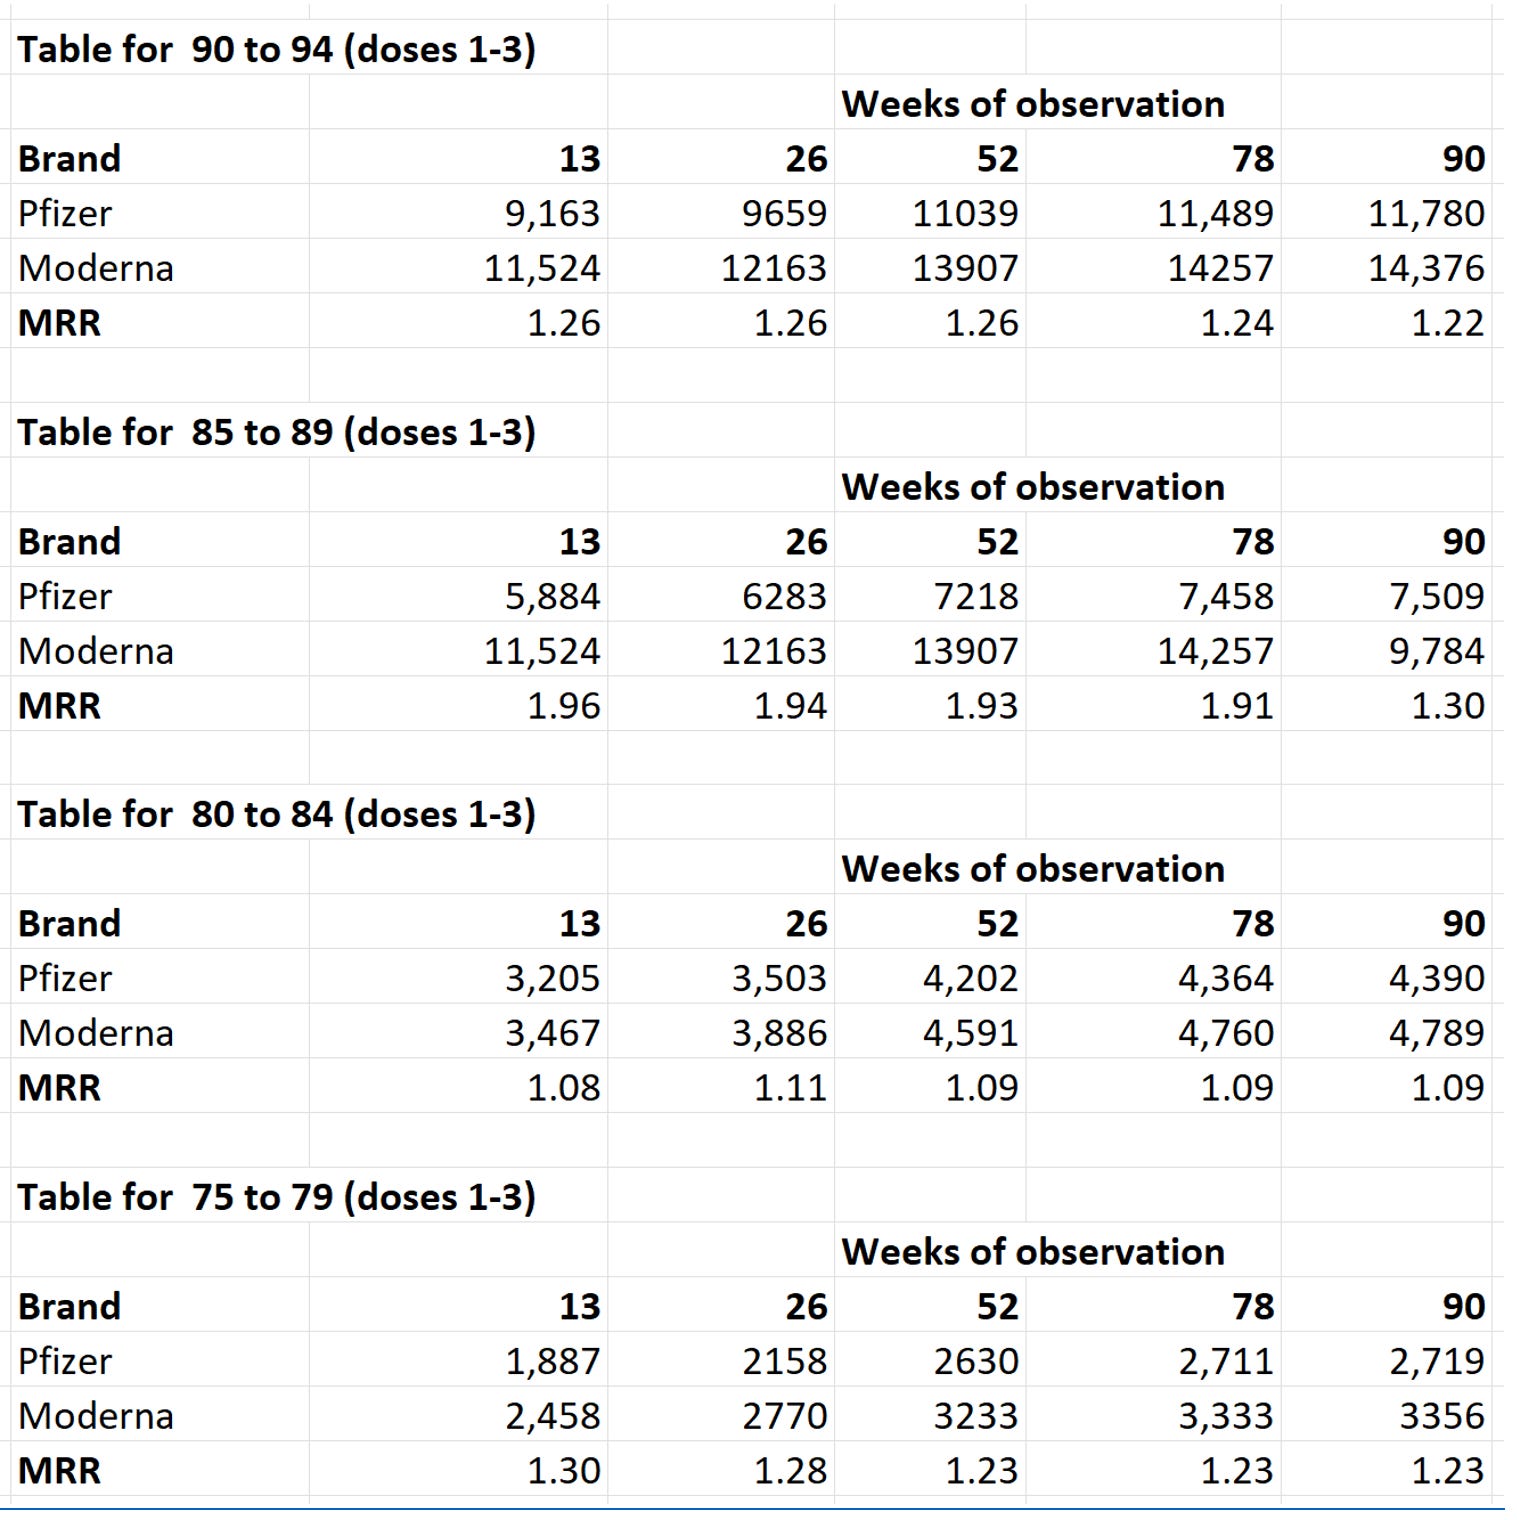
Consider this excerpt from the time-series “brand” spreadsheet which shows no matter what age you are, and what time period you observe after you got your shot, Moderna is consistently more deadly than Pfizer:
 |
They claimed that higher rates of comorbidities in the Moderna group could explain the findings.
We examined this as a possible explanation for the observed higher MRR for Moderna, and found that comorbidities are NOT correlated with the MRR so the hypothesis must be rejected.
In fact, I easily (in my first try) found 4 consecutive months where Moderna was getting higher comorbidities, yet the MRR was dropping. If comorbidities was a strong factor explaining the data, the slopes would be aligned, but they were opposite suggesting if there was any effect, it was minor. Also, people with high comorbidities were the first to be vaccinated so we looked at the MRR mid-year and found the same numbers when people with fewer comorbidities were vaccinated.
Also, the attackers never constructed a model of comorbidities that correlates to the MRR. Why didn’t they? Because they can’t because it doesn’t.
So by far, the most plausible hypothesis is that the reason for the MRR being >1 is because the Moderna vaccine killed more people per dose than the Pfizer vaccine. There isn’t any viable other hypothesis left standing that can explain the data.
And if they can’t explain this data, they have the additional problem of no chance of explaining the other data that confirms this data (such as from v-safe, VAERS, Yellow Card system, and the randomized trials).
Additional Support for findings
Quotes from reviewers
Articles validating the results
Other evidence from the Czech Republic that the vaccines are deadly
Denis Rancourt found a similar ratio in VAERS
No evidence of bias in policy
Consistency of MRR
New attack vectors
All of this was because Moderna got people with higher comorbidities
Socioeconomic Factors
It was all COVID
You didn’t look at all the combinations of dose and death
What the reviewers said
“My conclusion is the same as the others. Using Pfizer as a “placebo” (effectively assuming that it is safe), then all other “vaccines” are harmful - deadly in fact.
Now, if you believe that Pfizer is, therefore, the only one that is not
deadly, unfortunately, you have failed to grasp the implication of
this. What it actually means is that they are all deadly, just some are more deadly than others.”
— Joel Smalley, data scientist, excerpt from Analysis of the Important Czech COVID "Vaccine" Mortality Data
“Unless
someone can provide compelling evidence of Moderna having been given to
those more likely to die in every age group and throughout the
vaccination time period, then this is compelling evidence that it was
more deadly.”
— Clare Craig, excerpt from Moderna was more deadly than Pfizer
“Given that today it is unknown if the mRNA COVID vaccine products offer any benefits, in conjunction with the fact they are known to cause serious harm and death, while evidence continues to build supporting these products cause additional serious harms that are still unconfirmed. Taking this information together it should be obvious these products should be withdrawn from the market.
The Czech data set you present is clearly concerning and supports prior studies which have suggested Moderna is more harmful than Pfizer, as has been consistently identified in various manners as you refer to in your Substack post.
The Czech data you present is your best work to date, and you should be proud of it.”
— Joseph Fraiman, MD
Articles validating my results that Moderna was deadlier
Clare Craig: Moderna was more deadly than Pfizer
Clare Craig: Why I am backing Steve Kirsch on the Czech data / The attackers are wrong
Clare Craig: Double checking the claims about Moderna
Jessica Rose: The Czech mortality data - is Moderna deathier than Pfizer? My own very preliminary analysis.
Articles confirming that the Czech data shows the vaccines are deadly
Paper by Professor Norman Fenton and Martin Neil, New paper on Czech population-level vaccination data disproves claims vaccines are safe and effective.
Their conclusion was based on Czech insurance company data, not the official data we obtained.
Key excerpt:
“No matter how you cut the data, they have demonstrated that the observed data on vaccination cannot and should not be used to support any claim that the Covid-19 vaccines are or were effective or safe.”
The current data goes further and shows that the vaccines were not safe.
Articles about this research
Only The Defender covered what I found: Moderna COVID Vaccines More Deadly Than Pfizer’s? Maybe, Analysis Shows.
I’ll address all the points in that article here.
My favorite part is at the end when Denis Rancourt said his independent research found exactly the same 30% higher mortality for Moderna relative to Pfizer in the US data as we found in the Czech data.
Rancourt said Kirsch’s findings reported today also showed agreement with an analysis Rancourt did with Joseph Hickey, Ph.D., of the VAERS database.
In that paper, they also found that fatal vaccine toxicity varied by manufacturer, with Janssen’s shot being the most fatal, followed by Moderna’s and then Pfizer’s. The paper included details about toxicity, dose number and manufacturer.
Here’s a screenshot from that paper:
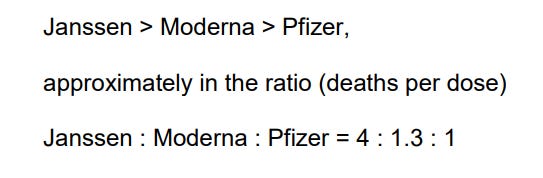 |
See that 1.3 number?
You’ll see it again, over and over in the triangle plot below and in Figure 1 above.
Henjin also validated CONSISTENTLY higher mortality for Moderna
Henjin is a data scientist who has produced voluminous work on this data. He believes the COVID vaccines are safe and the effect is caused by an unknown confounder. So he creates graphs to prove I’m wrong.
The problem is they do the opposite: they expose the truth.
Here are my two favorite graphs.
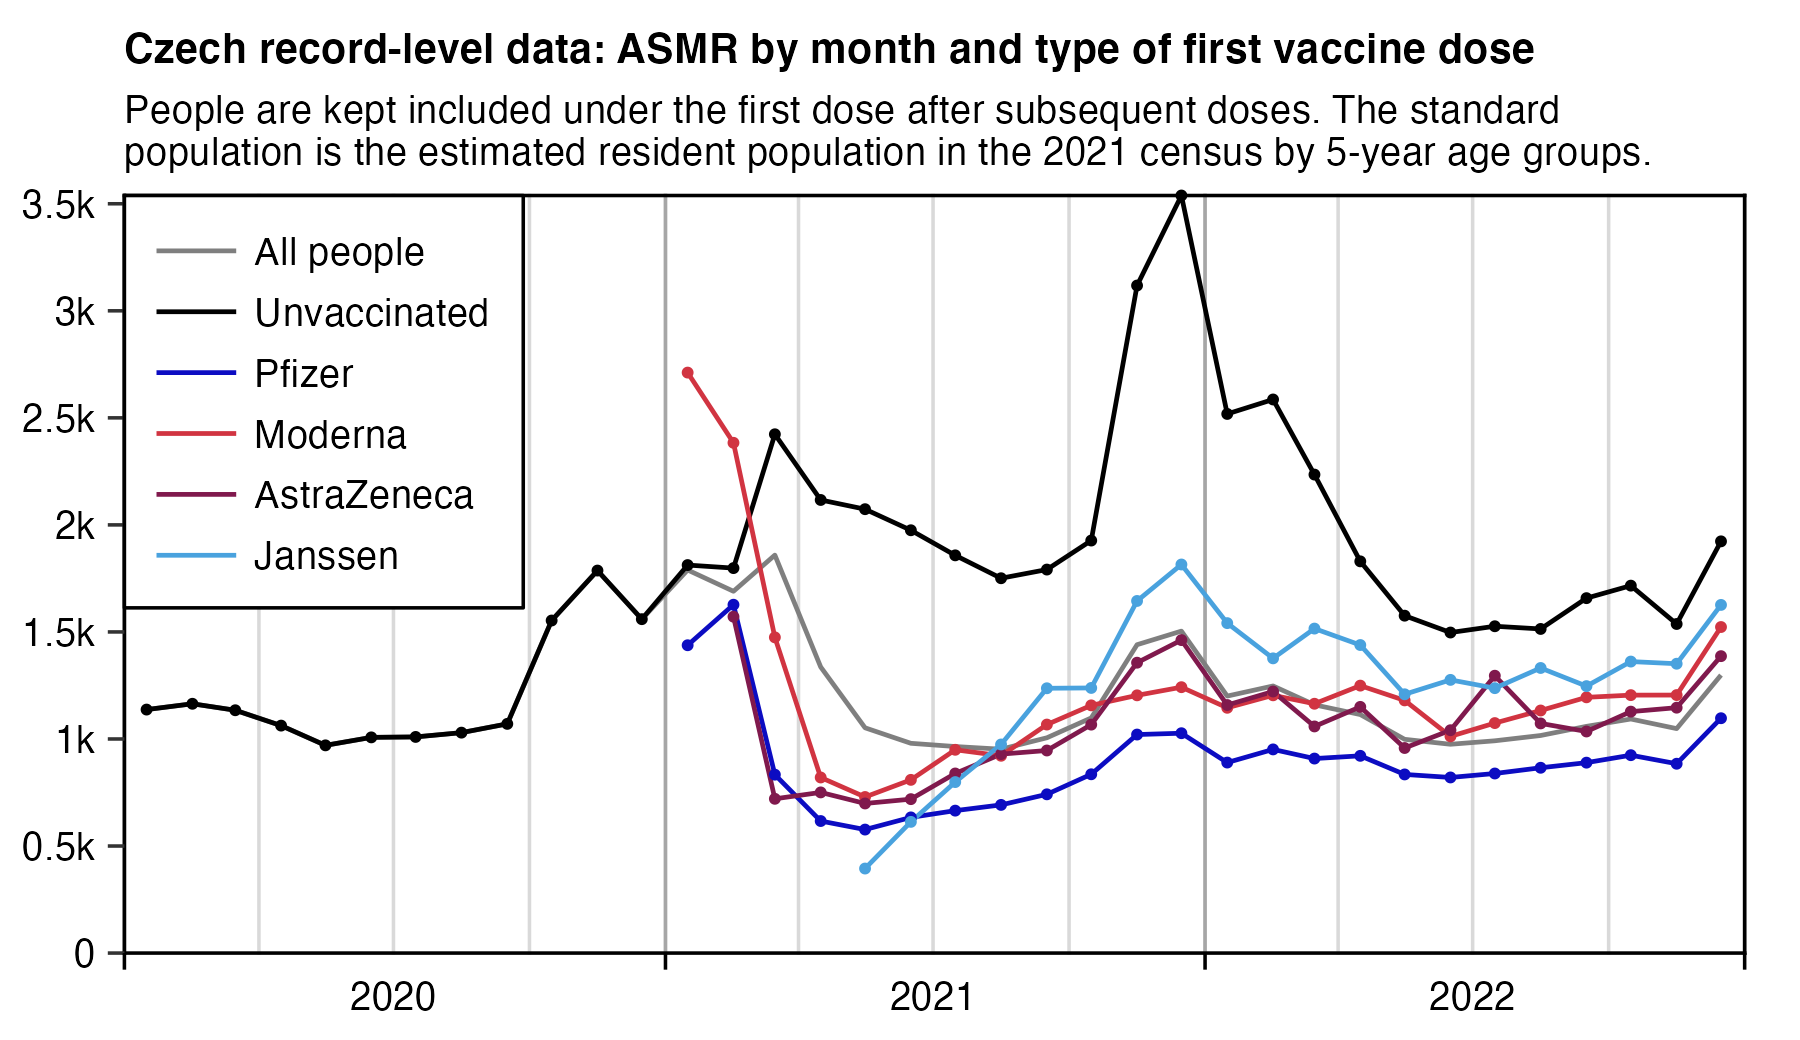
This is the killer plot because it can dispel the common attacks. It’s a plot of age standardized mortality rate vs. time for each brand:
 |
To analyze this data properly, we use advice from the London Underground: “Mind the Gap.”
 |
The gaps in this graph (between the Pfizer and Moderna lines) tell important stories!
Observe the following from the graph:
No matter what month you look, Moderna kills more people than Pfizer
When comorbidities are highest (start of rollout) or lowest (everyone else is added to the mix diluting the comorbidity effect), the separation between the vaccine mortality is still there which means it likely wasn’t caused by comorbidities.
The separation between M and P during “no COVID periods” was still present meaning the mortality difference wasn’t caused by differential effectiveness against COVID. The M shots caused a higher mortality during no COVID which means that they are deadly.
The gap size between the M and P shots didn’t widen or narrow during COVID periods meaning both vaccines had the same protection against COVID death (which appears to be ZERO) since the VA study showed the COVID shots didn’t impact probability of being hospitalized.
People who get vaccinated have increased mortality from the time from the first shot in 2021 compared to the unvaccinated (background death rate) which is falling. For example, compare the mortality rates in summer 2021 to summer 2022. So this can’t be explained by SES because the healthier SES group (who presumably got Pfizer) should have maintained their health difference over time if this were a safe vaccine. They shouldn’t lose ground to the unvaccinated. There is a healthy vaccinee effect, but it only lasts 3 weeks; after that, you hit baseline mortality if the vaccine is safe. In the COVID vaccines, we see mortality climb which is consistent with vaccine injuries.
And finally, the most important part of all is the direction of the gap. The attackers claim, “the gap is due to differential efficacy between the vaccines.” No they don’t because the gap exists in non-COVID periods. But look at which way the gap goes. If 30 mcg of vaccine is good, then 100 mcg must be more effective and Moderna should have LOWER mortality than Pfizer, right? Whoops! Higher dose —> Higher mortality. And Pfizer confirmed it too!!! The Pfizer FDA documents show they tried 100 mcg and found it was too toxic (too many serious adverse events) so they LOWERED THE DOSAGE to 30mcg to make it SAFER.
For the unvaccinated lines, please refer to the explanation here.
My second favorite chart is the Triangle plot of Moderna/Pfizer MRR by month of shot (y-axis) and month of death (x-axis).
This is like the first graph showing mortality over time, but this time the x-axis is the month of death so we can fairly compute whether there was an effect for every unique combination of vax data and death date.
He wrote me on X DM:
“I didn’t use ASMR in my triangle plot but the method that is known as the direct method of age-standardization. In order to get the expected deaths for each age group, I multiplied the person-days of the age group by the baseline mortality rate of the age group, and I added the expected deaths for all age groups together to get the total expected deaths for all ages. ASMR is a weighted average of age-specific mortality rates so it can be noisy in individual age groups have noisy rates. But I think my method is better than ASMR here.”
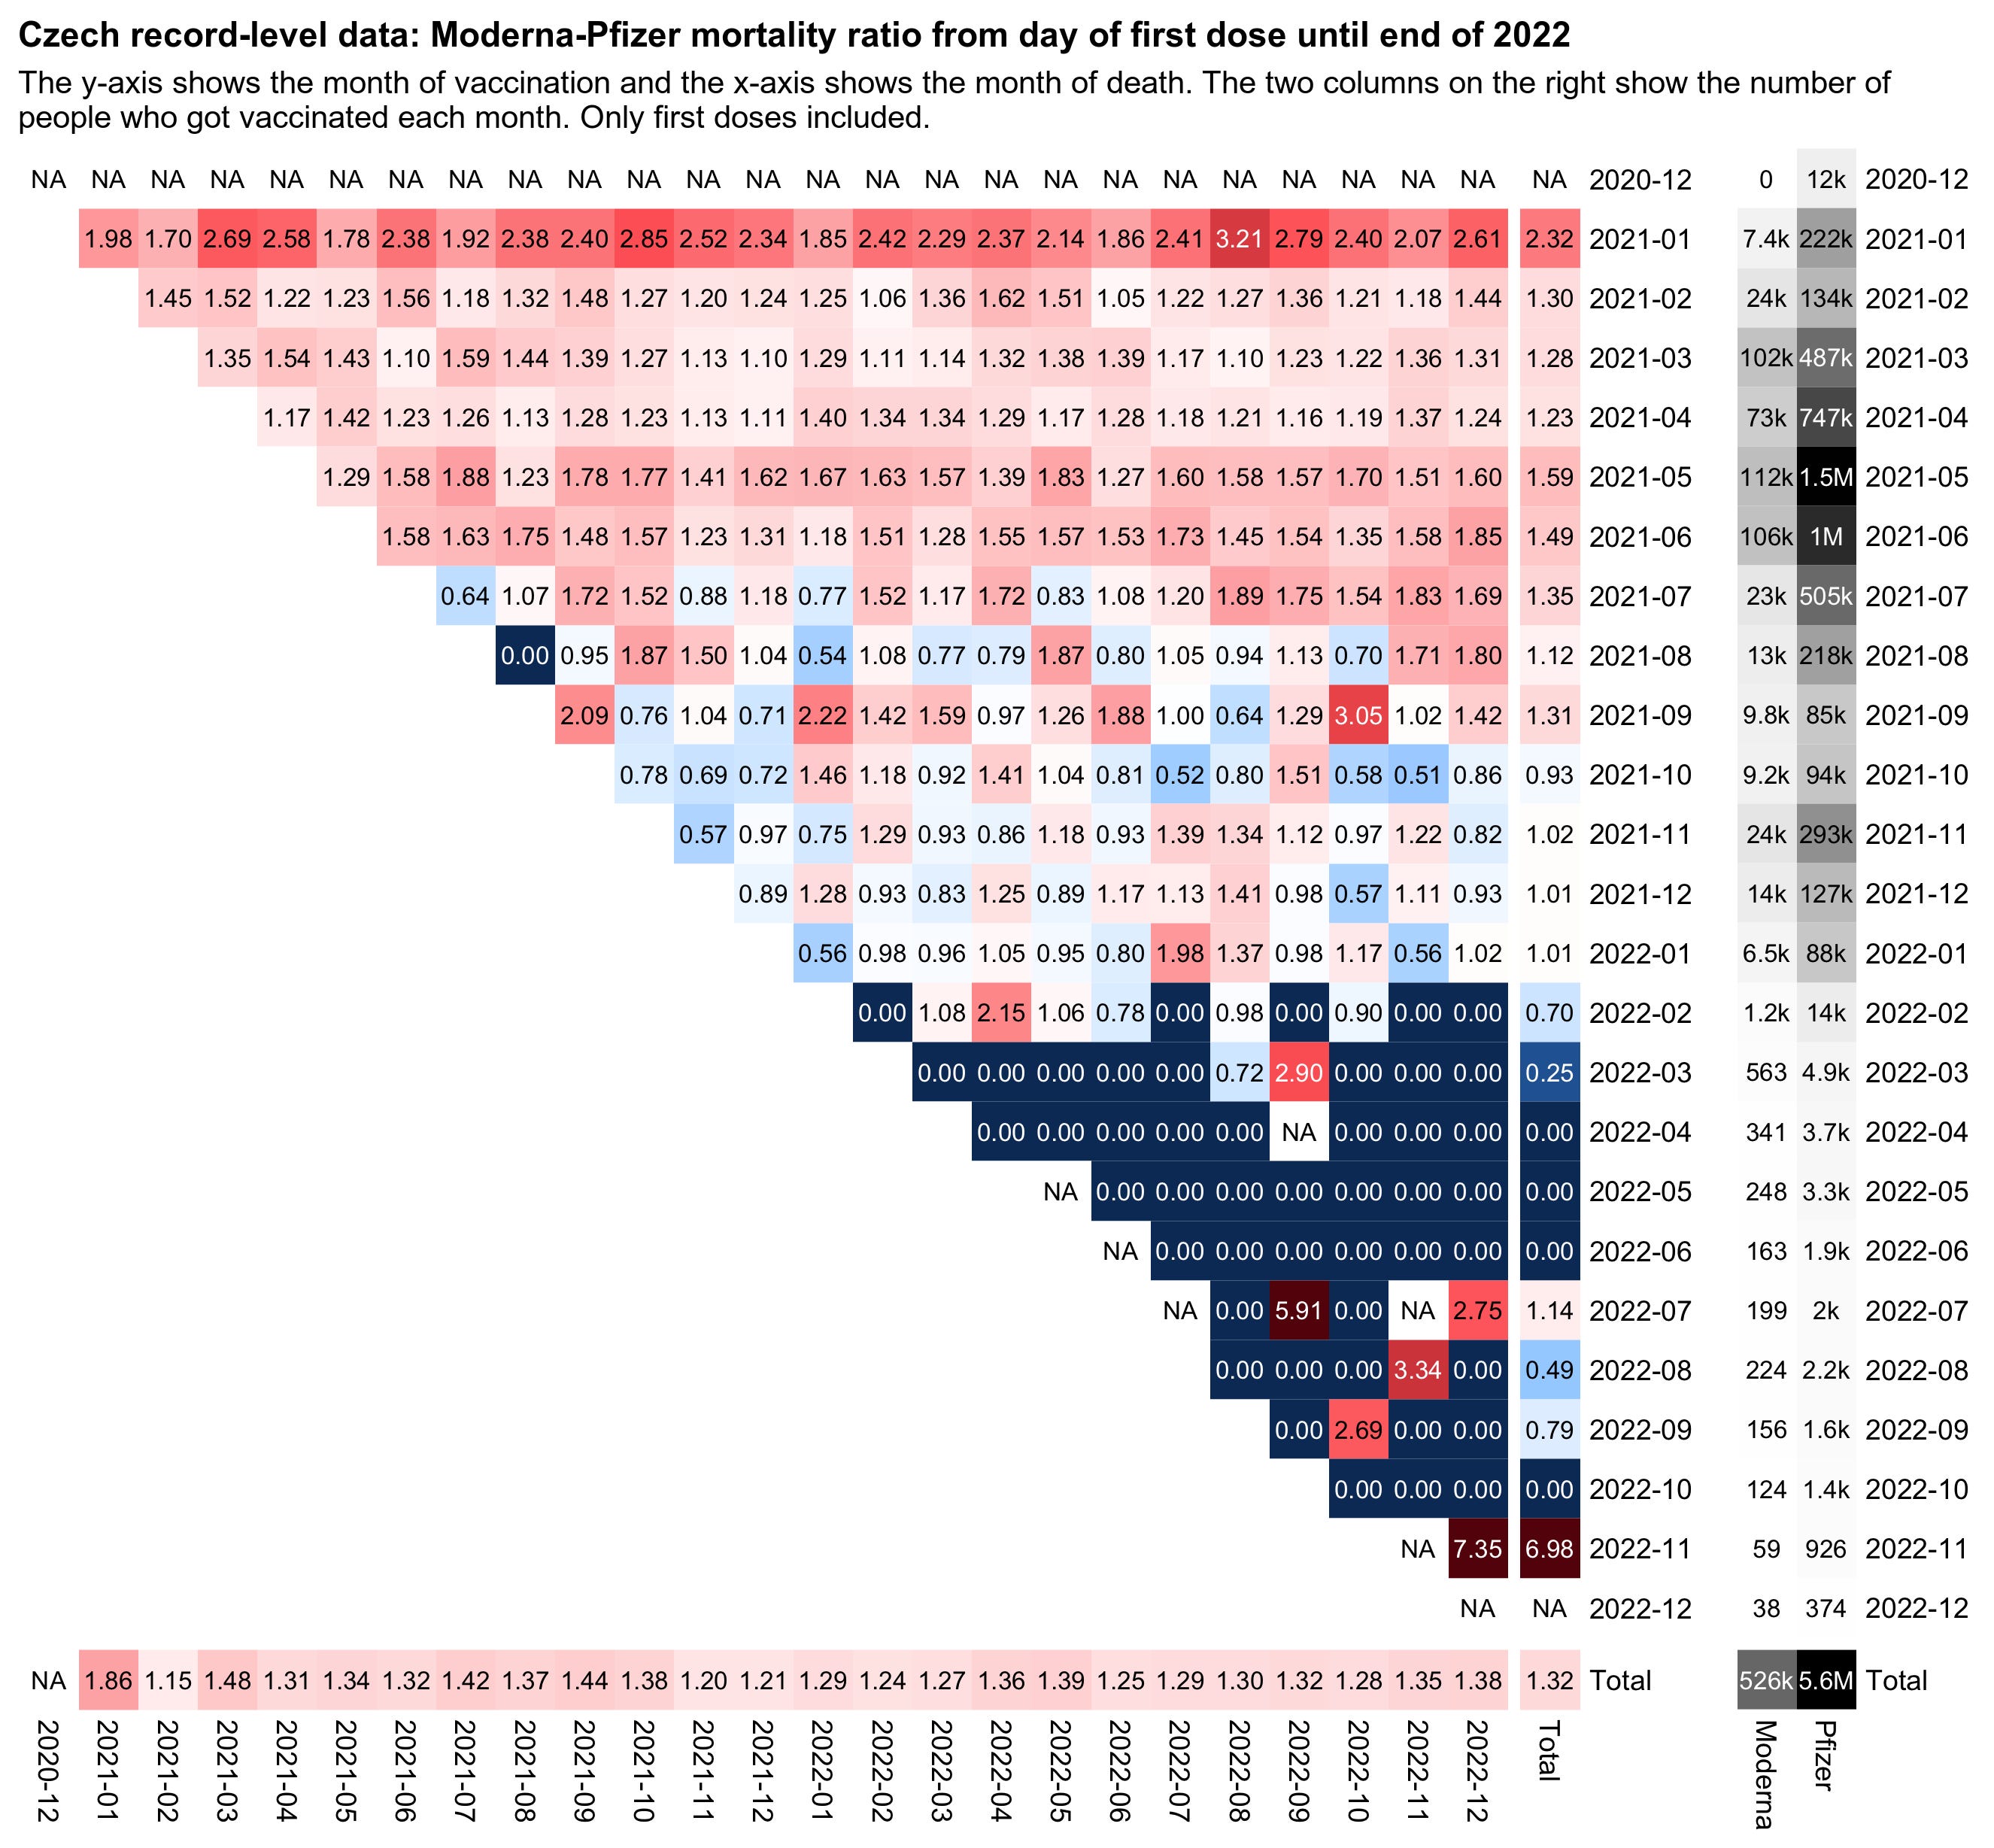 |
This shows that whenever there is sufficient data (lots of shots given), no matter when you die, the age-standardized MRR is around 1.3, give or take. That is very consistent. So this is the same gap we saw above, but now you can see that the time you got the shot or the time you died made any difference.
And after May 15, 2021, most all the “sick” people got their vaccines, and the effect is still there in the month of June as you’ll see below, by which time only a small fraction were “sick”.”
Not only that, the effect is even LARGER in June 2021 than it was in 3 of the 5 earlier months which suggests that uneven distribution by brand of people prioritized with comorbidities played a minor if any role. More on that shortly.
In short, when we had sufficient data to compute the value of any of the squares like we did in the first six rows, the squares ALL showed Moderna was deadlier than Pfizer.
I calculated the mean and std deviation of the values in each row above:
Month 1: mean=2.3308 std dev=0.3617
Month 2: mean=1.3130 std dev=0.1523
Month 3: mean=1.2891 std dev=0.1422
Month 4: mean=1.2443 std dev=0.0887
Month 5: mean=1.5740 std dev=0.1772
Month 6: mean=1.5089 std dev=0.1726
Month 7: mean=1.3333 std dev=0.3892
Month 8: mean=1.0906 std dev=0.4994
After June 2021, the findings are not statistically significant because the numbers are too small. Focus on the Months 2 through 6 which have the most data and the lowest standard deviation.
Guess what you find?
You find that the effect is always more than 2 standard deviations from 1. In short, we’re 95% confident there is a mortality difference if we just do it on these individual bucket samples (we get higher confidence when the buckets are not so small, e.g., those vaccinated in a month or a quarter).
In months 2 through 6, there are 110 different month vax date/death date samples. So 110 different opportunities for Moderna to be safer.
Moderna lost 110 out of 110 safety “competitions” where there was sufficient data in both high and low comorbidity cases.
It cannot be just coincidence that we see the same increase in AE’s in the trial compared to placebo. There it is in the same ratios every month. The consistency is striking.
I have now built a time series spreadsheet by single age and including brand information (the COxx brand code without the CO) where the mortality rate can be calculated for varying time periods after vaccination and for combinations of doses. Most of the analysis reported thus far has been based on single dose data.
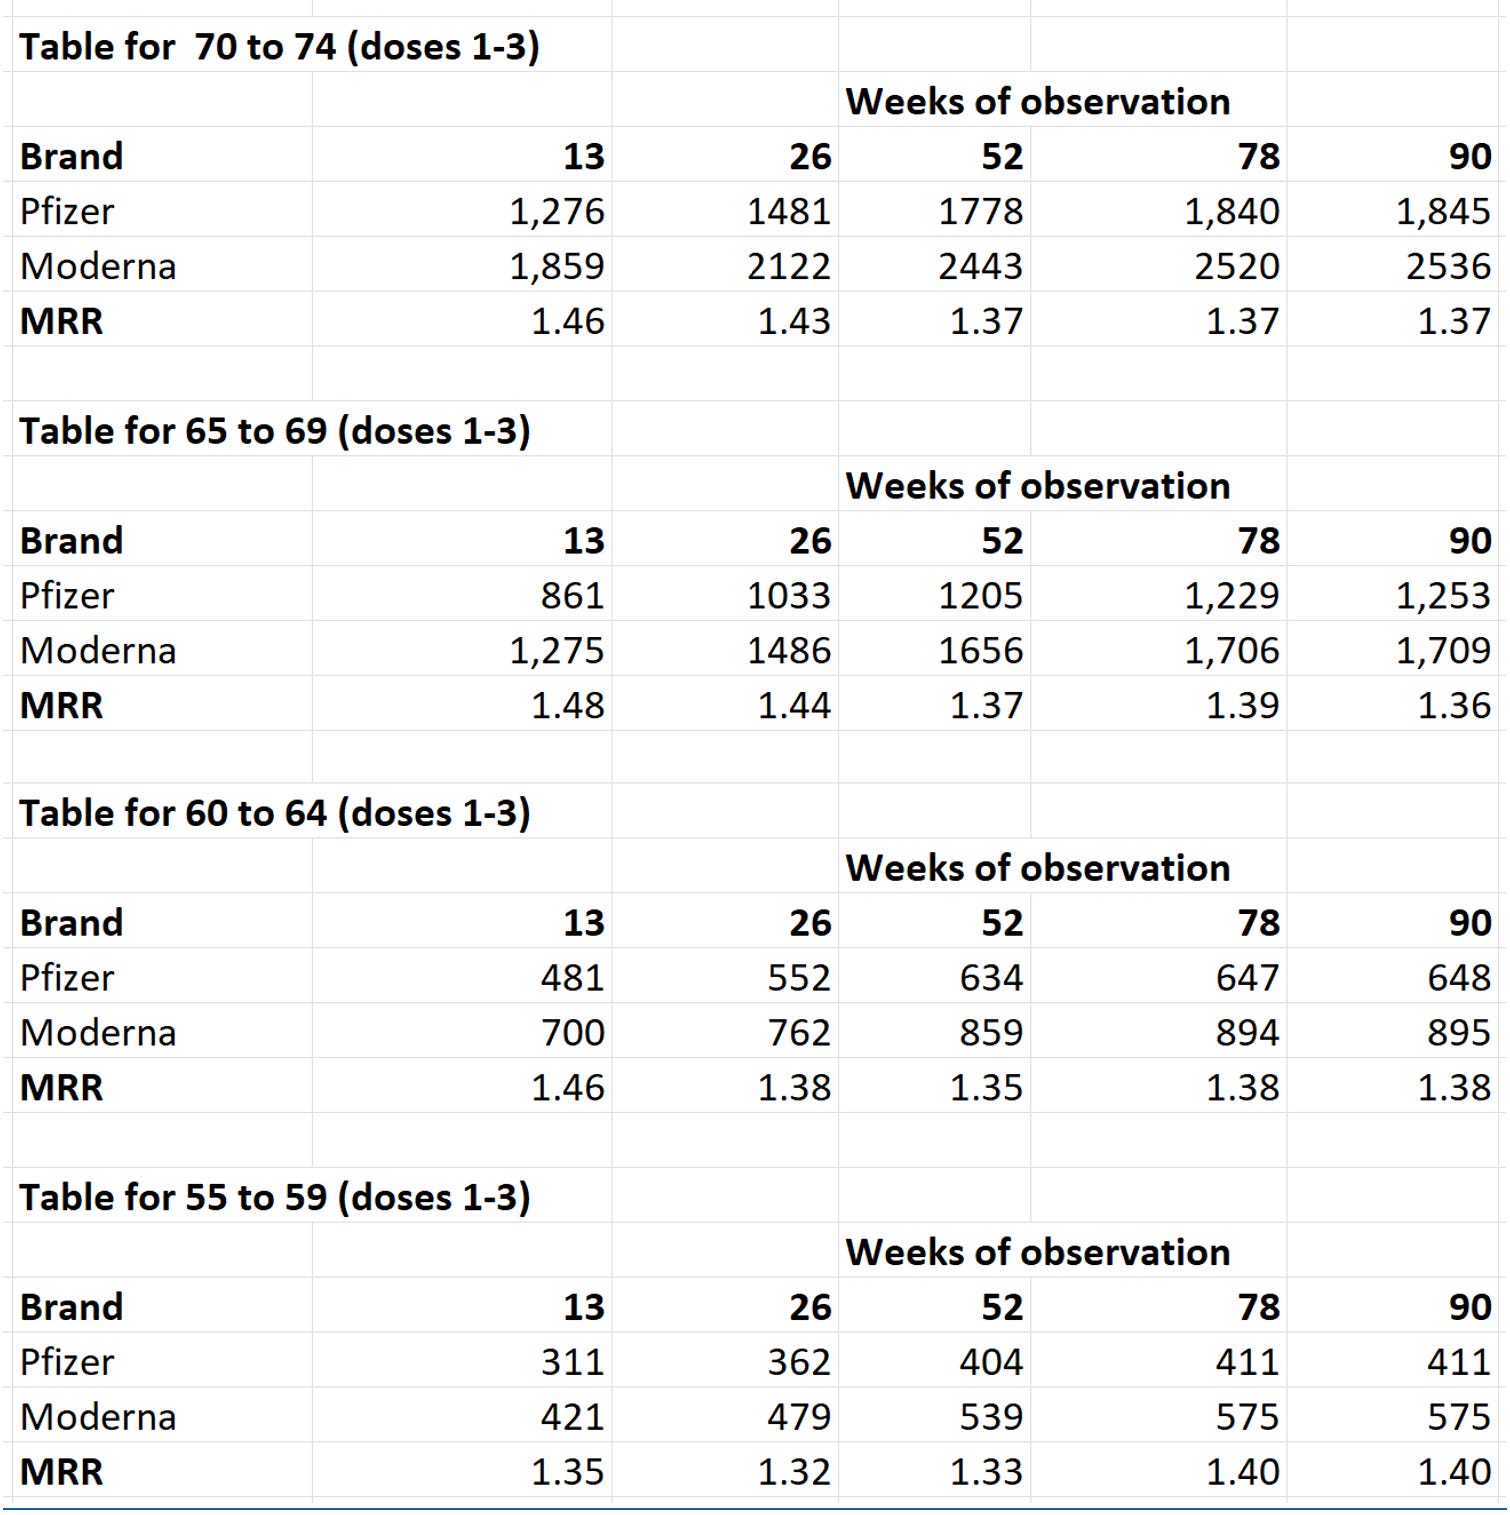
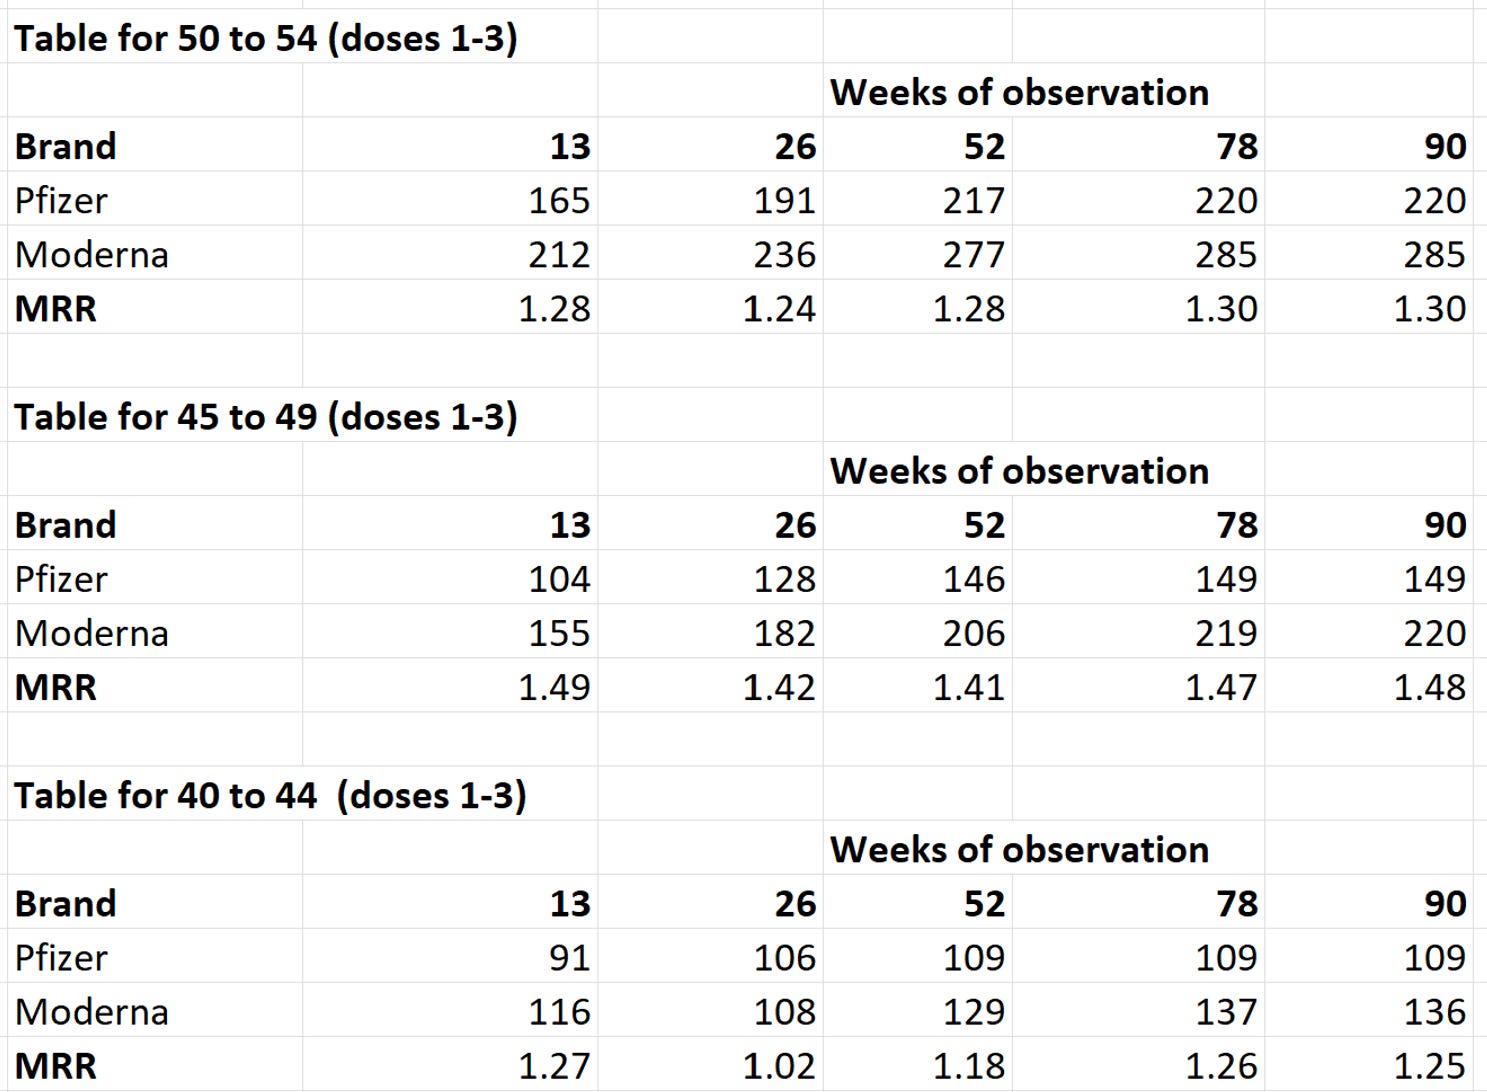
When combining the data for all three doses from the time series, the MRR rates become strikingly consistent as shown in the tables below.
 |
 |
 |
See this spreadsheet to see this for yourself.
Either this is the greatest coincidence of all time or the Moderna vax is unsafe.
The latest graph from Henjin show Moderna could be even more deadly than we calculated
Even worse for the vaccine advocates is this data Henjin just posted on his page:
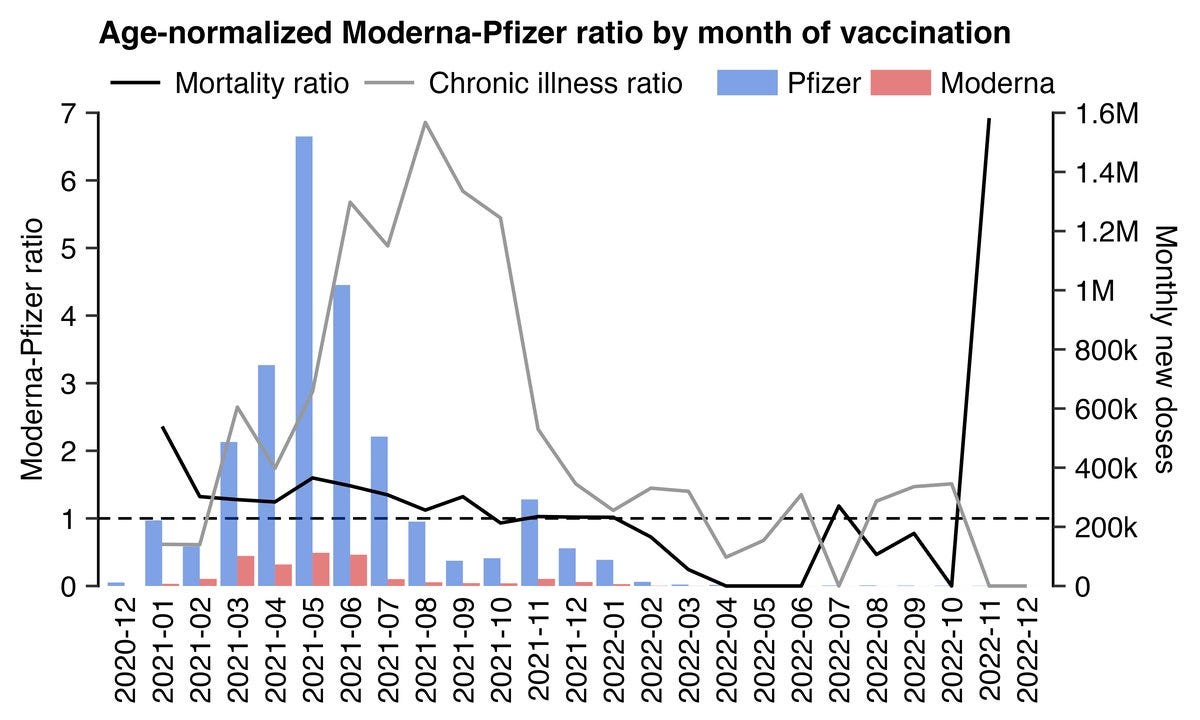 |
What this shows is that the MRR (in black) is falling when the comorbidity ratio is rising (and there is sufficient data). I found the same thing as well so this isn’t a fluke (details below).
What this means is that their own guy is decimating their hypothesis. I just love it when they do this.
Also note that the first two months have a high MRR but a very low chronic illness ratio (Pfizer had most of the comorbidities).
In other words, if anything, higher comorbidities is inversely correlated with MRR.
That means the MRR for Moderna could very well be even worse than we thought!
They’ve solidified our data.
The other data confirming the Moderna is deadlier than Pfizer
This study shouldn’t be viewed in isolation. There are plenty of other data sources where we see the same effect. It’s unlikely the exact same confounders in the Czech Republic were in play in all of these studies and other corroborating evidence.
See this summary which talks about each data source and the Moderna/Pfizer mortality or SAE ratio summarized here:
UK Yellow card system: 1.5X
My VAERS analysis: 1.3X
V-safe data: 1.8X
Fraiman study: 1.5X
Rancourt VAERS study: 1.3X
Dose of mRNA: 1.5X
Pfizer FDA materials: Pfizer found that doses above 30 mcg were too toxic to be used. Moderna’s dosage is 100 mcg.
These are big effect sizes and they keep showing up in other countries. Coincidence? Or biological plausibility (caused by the higher dose)? Which do you think is more likely?
Other data that cannot be explained by confounders that is consistent with the unsafe vaccine hypothesis
They cannot explain, with data, any other independently verifiable observations that are consistent with the vaccines have killed people:
They cannot explain any of the 100% verifiable anecdotes like what Jay Bonnar passively observed. Probability of this happening by chance: 5.6e-22. There is only one explanation, isn’t there?
The stats of Ed Dowd’s book Cause Unknown (499 out of 500 who died of unknown causes) were vaccinated when it should have been only around 75%. Probability of this happening if the vaccines were safe: 6.1e-10.
And many others
Heck, I’d be thrilled if they could explain just #1. Nobody wants to touch this because it is 100% verifiable. No fact checker has ever called me on Jay’s story.
Where is the evidence showing that the effect in the Czech data cannot be caused by an unsafe vaccine?
They cannot show that the effect observed in the Czech Republic data could NOT have been caused by a deadly vaccine.
And yet, some of them (such as Henjin) completely rule out that possibility (since they believe that vaccines ONLY kill people a few weeks after the shot) and claim there must be a mysterious confounder that nobody can describe that is causing the huge effects observed.
Have you ever wondered: why aren’t there ANY personal vaccine success stories?
Conversely, where are the vaccine “success anecdotes” like this HYPOTHETICAL example:
“My friends were all dying like flies from COVID until the COVID vaccines rolled out; now it’s just my unvaccinated friends who are dying of COVID. All my unvaxxed friends now regret their choice and are rushing to get caught up!”
Have you ever heard such an anecdote? NOTE: I just made that up so don’t quote me please!!
I asked for such stories on X:
 |
And what I got were stories consistent which Jay Bonnar observed:
 |
How can these stories be so consistent? The 1 died from COVID hospital protocols (not COVID) vs. 15 died from the jabs?? That should be impossible to find.
And my favorite comment (now with over 44,000 views) on the thread asking for a personal success story was this:
 |
Yup. I’ve not seen a single ad. Isn’t that strange? :)
The burden of proof is on them to show how the Czech data proves the vaccines are safe, not the other way around
The prima facie evidence from the Czech data shows it is deadly.
They have completely failed to explain why this data shows the COVID vaccines save lives.
Professor Morris says that I haven’t eliminated all possible confounders as possibilities.
He’s correct; we’ve only shown here that every confounder they’ve identified cannot explain the data!
But this is the wrong argument.
The burden is on them to show this is safe and Professor Morris conveniently has plenty of time to throw darts at the Czech data, but he admitted to me that he lacks the time to do his own analysis proving that this data is more likely to be consistent with “all the vaccines are safe” hypothesis than the “vaccines are unsafe” hypothesis.
Dang. This is the best data ever disclosed in world history and Professor Morris doesn’t have time to explain why this data shows the vaccines are safe?!?!? I’m not buying it.
What data do they have showing it CANNOT possibly be due to the brand being more dangerous? If it was caused by the brand, the ratio would be consistent every month. In every month with sufficient data, it is!
He’s certain he’s right, but sadly, none of the people who advocated for the shots have time to analyze this data to show that it is more likely consistent with their “safe and effective” beliefs.
I reached out to Paul Offit and pleaded for him to look at the data but he said “Thanks but no thanks.”
Is this the way science works? You avoid data that exposes the fact you were wrong and killed lots of people?!?!
NOBODY IS PRODUCING ANY ANALYSIS OF THE CZECH DATA SHOWING IT PROVES THE VACCINES ARE SAFE.
Even more troubling is that Moderna and Pfizer aren’t going to touch this with a 10 foot pole. It’s a third rail for them. They have the resources to analyze public health safety data, but they can’t make the case so they will ignore this data in plain sight and “not comment on third party studies.”
If their vaccines were safe, the manufacturers would be all over this data in a heartbeat, wouldn’t they?
I’m OK with that. Perhaps they have other priorities than looking at safety signals of their products?
If they don’t have the time to debunk this data, then honest regulators need to take their shots off the market until they make analysis available. It’s that simple.
Of course, the term “honest regulator” is an oxymoron, isn’t it?
They really don’t care how many people are killed because they are never going to be held accountable for the deaths by the lawmakers since the lawmakers were to blame as well.
As Joel Smally has eloquently pointed out:
As I have said so many times before, we should not lose sight of who has the burden of proof. Those who brought this intervention have an absolute obligation to prove they are both safe and effective to acceptable standards (i.e. at least 95% confidence, 99% in the case of some medical interventions).
The fact that we can actually prove the opposite (that they are both unsafe and ineffective), in spite of their feeble attempts to rubbish our analyses, demonstrates how impossible it is for this product to remain on the market for so long, let alone be funded with public money and even mandated in some circumstances.
It is blatantly criminal. Anyone still buying this BS needs to be in a lunatic asylum or jail.
Well said Joel!
Four new attacks
People who got Moderna had higher comorbidities
People who got Moderna had a lower socio-economic status (SES)
Pfizer protected more effectively during COVID so that’s why Moderna looks like higher mortality… it’s actually just “less protection”
The effect isn’t consistent. If you look at data where the numbers are really low, the effect disappears!
Claim #1: All of this was because Moderna got people with higher comorbidities
The core attack has been that the Moderna group were expected to die more because there was some kind of accidental selection bias where all the sicker people were more likely to get a Moderna shot.
This hypothesis can be disproven in three ways:
No evidence there was systemic bias in distribution
More deaths were expected in the old so they should see highest ratios but they don’t; the ratios were the same in all age groups
At the start when the sickest were prioritized, Pfizer had most of the comorbidities but the MRR was even higher! See the triangle plot above.
There was no systemic brand bias
One of the Czech researchers wrote, “I now have confirmation from the State Drug Administration that at no time during the vaccination campaign was one mRNA vaccine brand preferred over another in indication for any patient group over 20 years of age.”
No systemic bias —> There will be pockets of bias favoring one brand over another. But because there are so many samples, it is highly probable that there are similar numbers of samples in the other direction so that at the end of the day, things are roughly balanced.
You’re essentially doing random draws from a normal distribution (the central limit theorem guarantees that).
The chance that one brand drew from the same extreme end of the normal curve in every month and in every age group is possible but extremely small.
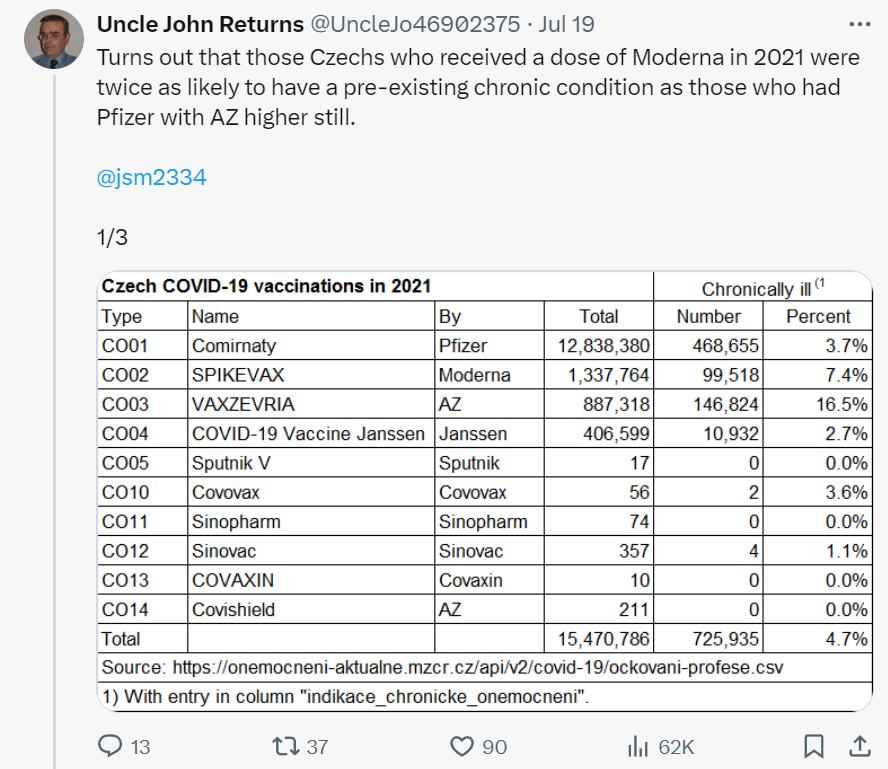
Even Uncle John Returns (UJR) couldn’t find any BRAND bias whatsoever:
 |
So this applies to socio-economic status (SES) arguments as well as comorbidity arguments.
THERE WAS NO SYSTEMATIC BRAND BIAS for SES or comorbidities or any other possible confounder.
More deaths are expected in the old so they should see highest ratios but they don’t
For people in their 40s unexpected deaths make up 30-40% of total deaths and this figure falls with age dropping to around 10% for people in their 80s. Even if it was possible to find the sickest people and inject them with Moderna in preference to Pfizer it would have a different impact on all cause mortality in these different age groups. The effect should be larger for the old and smaller for the young but what we see is the other way around.
The Uncle John Returns (UJR) attack
His claim is that the people who got Moderna had higher comorbidities; that’s why they had a higher mortality. He believes the MRR>1 had nothing to do with the shots (he doesn’t show how he can eliminate that as a confounder) and everything to do with the uneven distribution of brands favoring Pfizer.
Here’s his post:
 |
And then, without any further data analysis, then he declares this is sufficient to invalidate my results:
 |
Then he adds more detailed analysis in this post:
 |
I don’t know if his analysis is correct but it doesn’t matter. Let’s assume they are right. If his charts are right, it proves his hypothesis is wrong!
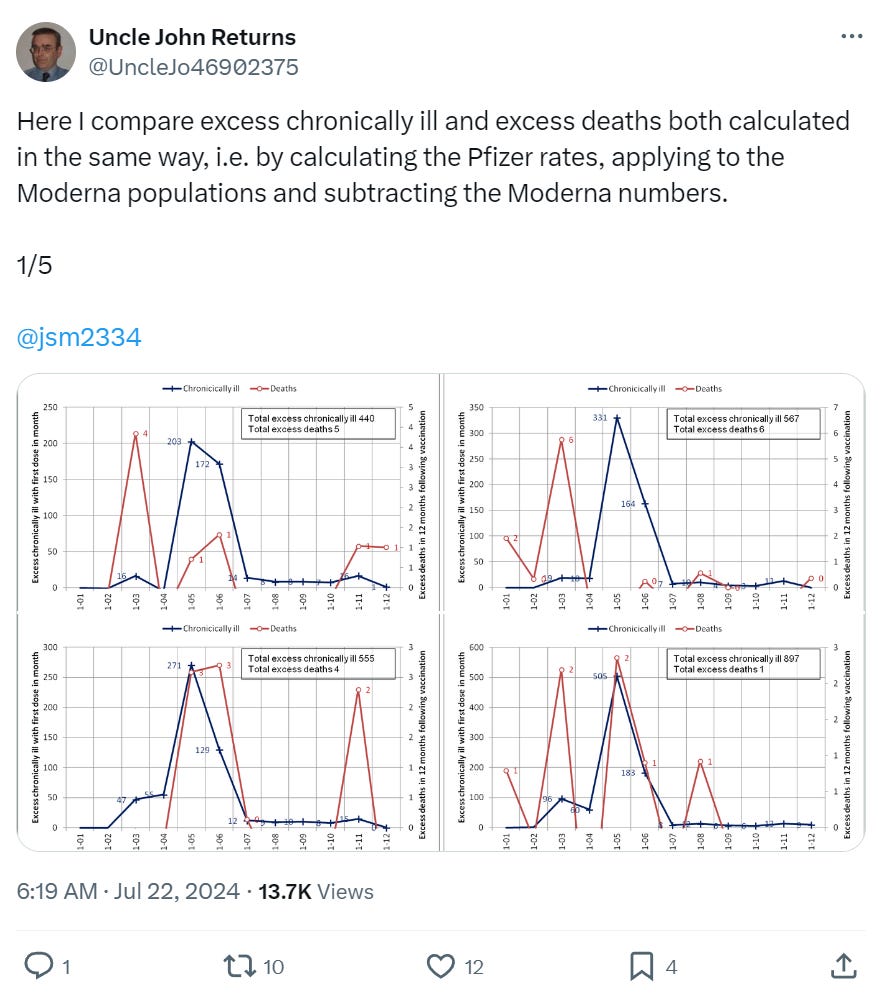
Check out these graphs which are from his post:
 |
 |
Look at May and June in the two graphs above.
May: High comorbidities, low deaths
June: High deaths, low comorbidities
In the graphs for 50 year olds, we see the opposite.
In 60 year olds, we see the same relationship as the 40 year olds.
 |
 |
So it flip flops meaning there isn’t a solid relationship so we have to reject the hypothesis that the brand differences were due to distribution differences w.r.t. comorbidities.
Which means comorbidities played only a minor role.
The comorbidity data cannot explain the findings. If it were Moderna being given more to those with comorbidities Moderna would look deadliest in early months and lower by month 6 when comorbidities made up a much lower absolute number of those vaccinated.
In February, the comorbidity ratio was 0.83, so Pfizer had the sickest people – yet those who had Moderna still died more.
There were a few months where Moderna was used heavily and the sick were prioritized. However, by May and June the healthy were vaccinated. The proportion who were sick was very low and yet the MRR was maintained.
So the trick is simply to look at MRR for those vaccinated in a single month when the sick were prioritized and a single month when the healthy were. Then you have a fair comparison. If MRR is similarly high for both it cannot be because of comorbidities.
The MRR really doesn't change much based on month of vax (except in the first month), so we're fine.
The fact it is SO consistent (MRR in prioritized months = non-prioritized months) SHOOTS down their hypothesis. And the MRR in non-prioritized months ALONE is the fair test.
Clare Craig’s defense
Clare Craig’s detailed comorbidity analysis shows that even though there were these biases that did exist in some months/ages, they cannot explain the result. She summarized her result in the subhead: “Data on comorbidities does not undermine previous findings.”
The most stunning finding in her analysis for 30-39 year olds:
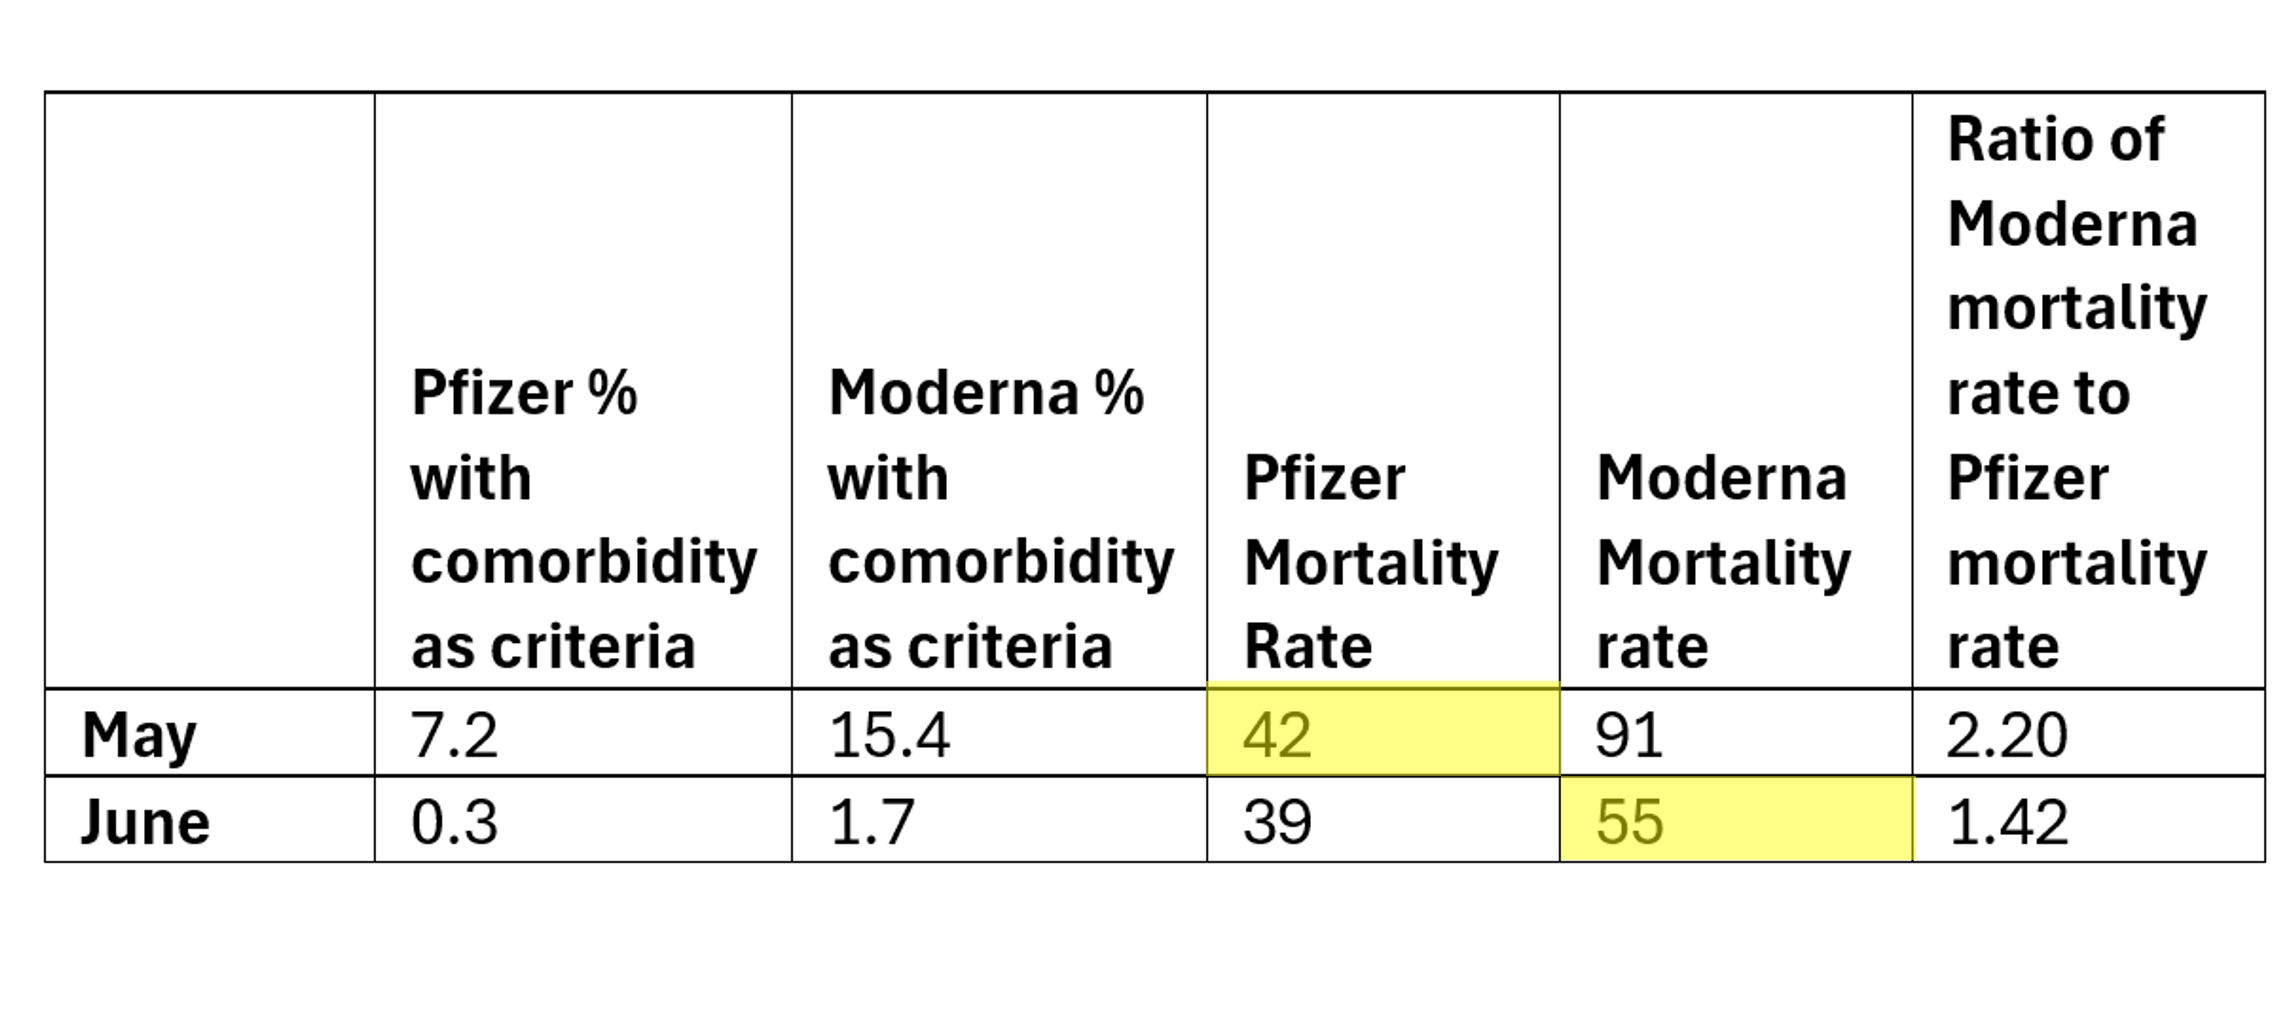 |
The mortality rate was higher during the healthy vaccination month with Moderna than during the sick vaccination month with Pfizer.
In other words, when Pfizer had 7.2% comorbidities, the mortality rate was only 42. But when Moderna has just 1.7% comorbidities, the MR was 55. If comorbidities were driving the MR, the MR for Moderna should have been much lower than Pfizer.
Essentially, comorbidities didn’t skew the MRR.
I have many other examples, but you get the point. They can’t explain the effect they identified fits the data.
Claim #2: Socioeconomic Factors (SES)
If Moderna was given out in a manner that selected for disadvantaged groups compared to Pfizer, then a higher mortality rate would be expected.
For it to be SES Moderna must always be given to lower socio in every month and every age group. There was never one exception? It would be like throwing a fair coin and getting heads every time. There is no data to support this! It’s a complete hand waving attack. There was no protocol to give Moderna to different groups. If it were distributed in an uneven way it would behave as a cluster randomized distribution normal distribution. Central Limit Theorem says you can’t sample on one side of the normal curve consistently. We’d expect months within age groups where the other brand would be on top, not such high consistency. There are none.
If there really is such a confounder that increases mortality by 30-50% in every age group everyone should be told! It could transform public health!
The rollout was not even across socioeconomic groups. Those in higher groups with sharp elbows would have had readier access. Lower socioeconomic groups were harder to reach and there were campaigns to try and increase uptake in these groups. If socioeconomic differences accounted for the difference then we ought to see this become exaggerated with the passage of time. It does not. Instead we have stunning consistency.
Socioeconomic factors likely do explain part of the difference between the mortality rates for the unvaccinated and vaccinated. The healthy vaccinee effect is over after three weeks yet the vaccinated mortality rate keeps rising even while the unvaccinated mortality rate is flat in 2021 save for seasonal variation.
Claim #3: It was COVID
The MRR difference was not a result of differential effectiveness in preventing death. Even if there were a difference in covid mortality the impact on non-covid mortality cannot be this large – covid deaths would amount to a rounding error in the ratio. How big was the difference? A JAMA paper showed a normalized excess hospitalization rate was about -79% for people whose first shot was Pfizer and -77% for Moderna. A 2% difference on a 10% cause of ACM cannot explain the 30% ACM difference.
The dose of Moderna is three times higher than Pfizer, so it would be perverse to imagine it would be less protective from a COVID death.
The Hungary study shows the COVID vaccines reduced mortality during COVID
The paper analyzing the Hungary data concluded that Pfizer reduced mortality from COVID by more than 50% and Moderna by 43%.
They didn’t examine mortality differences between the COVID vaccines during non-COVID. So they didn’t look for a safety signal. They simply compared with unvaccinated comparators. Whoops!
They said the data was available upon reasonable request. I requested the data 9 months ago and they still haven’t replied. Why do they have to keep the data secret??
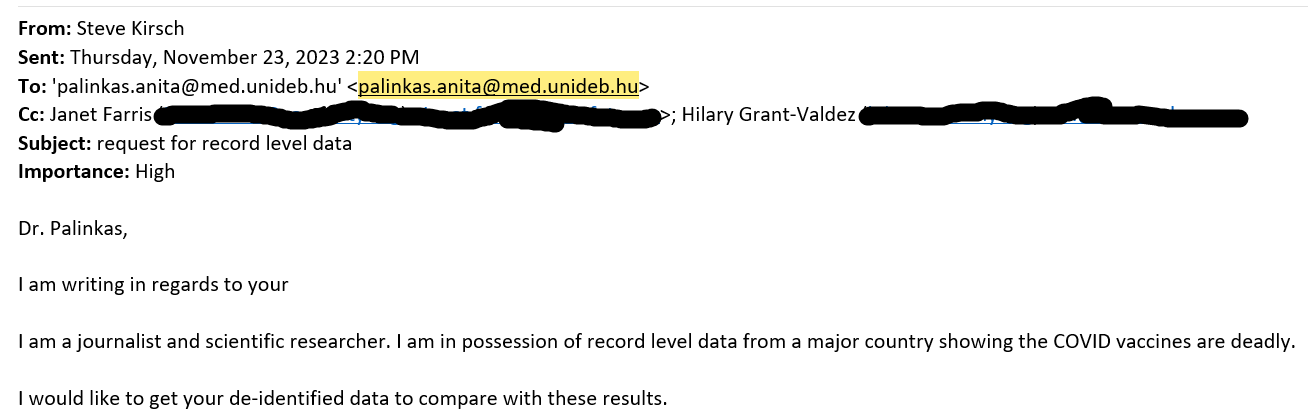 |
If these vaccines reduce hospitalisations, how do they explain the Veterans Affairs (VA) data study published in JAMA showing vaccination made no difference whatsoever on hospitalization? How can it be the cause in Czech and not here?
The data is there but the analysis for safety is missing. There is no record level proof of safety.
Claim #4: You didn’t look at all the combinations of dose and death
Denis Rancourt posted this critique saying I didn’t look at all combinations when I wrote the initial article. He also mentioned it in the CHD article.
He’s correct; at the time I wrote the article I hadn’t analyzed all the combinations.
I did after I wrote my initial post just to be sure I wasn’t missing anything and all my work was posted to my github so there’s a public record I did this days BEFORE he made his post which is a nice fringe benefit of doing your work in a public repo.
The vax1.xls spreadsheet can be used for any combo analysis of shots and death dates. The vax2.xlsx can be used for mortality analysis 90, 180, 270, etc. days after someone got the shot.
The triangle graph above shows in 110 combos where there was the most data, the results were consistent.
How can they reject this data with a straight face?
It’s simple. They have a belief system and they are unwilling to consider any hypothesis that is inconsistent with that belief system, even if it perfectly explains the day. Therefore, since they can’t explain the data, they conclude “it must be due to some confounder we haven’t discovered yet.”
For example….
Henjin who is a data scientist who has produced voluminous work on this data told me in an X DM that the differences between brands are actually due to:
Differential efficacy against COVID. It’s interesting he concludes that because he has never calculated this and has no 95% confidence bounds on it.
Some unknown confounder. Are we to believe that the same confounder is present in the UK (Yellow card system), US (VAERS and V-safe systems), and the gold-standard clinical trial (Fraiman) with very similar magnitudes? In his view, it’s just a coincidence that all these systems register similar numbers. Although he can’t identify the confounder(s), he assumes they must exist since he can’t explain the data. But the burden is on them to show these vaccines are safe. If I present evidence to the contrary, they can’t just wave their hands and say, “it must be caused by something!”
I’ve pointed out many times that the MRR value can’t be due to differential efficacy because the mortality difference happens when there is no COVID and is the same magnitude during COVID.
Henjin believes that there must be a confounder because everyone knows that vaccines only can kill people right after the shot. It’s simply not conceivable to have a mortality curve for each vaccine that varies over time and can last for a year or more! Therefore, because he holds that strong belief (which he has no evidence to support), then all these effects must be caused by one or more confounders.
I asked him, “What evidence does he have to support his belief that vaccines cannot possibly kill people for more than a few days after the shot?” He avoided answering that question.
And then he points to the fact that the MRR goes in the opposite direction in early 2022 such as March of 2022, but this is due to too few people injected in that month for Moderna to calculate an accurate MRR. So it’s all statistical noise. Do you notice that there are no 95% confidence intervals on the bars? The clue is when there is no consistency across a horizontal band that you are dealing with noise (eg., a mix of red and blue boxes).
 |
I asked him why he ruled out the vaccine as causing the MRR and he agreed the 03-2022 data is too skimpy, but he said the 11-2021 data proves his point that it cannot be the vaccine causing this.
Here is his age standardized mortality per month for those shot during 11-2021:
 |
So the MR ranges from .57 to 1.39. This is statistical NOISE; there isn’t enough data. This is the ONLY way he gets Moderna to be safer is when there is too little data and it’s all noise.
So there you go!
No matter how strong the effect is, no matter it is consistent everywhere, no matter that young people die on the same day as the shot, no matter that V-safe has a safety profile for both vaccines that is unprecedented (i.e., really unsafe), and no matter than there is no other viable explanation, and no matter that the “vaccine is deadly” hypothesis fits the data, he still believes that the vaccine must be safe and there must be a confounder that explains what we are seeing. He cannot accept, even for a minute, the possibility that the vaccine may be unsafe.
And all the vaccines are safe too, even the ones withdrawn from the market for safety reasons. Did you notice he never concedes any of the vaccines are unsafe?
That is how they think.
Because the vaccine is safe, an unknown force is causing the effects we observe.
So what data do they have that makes them certain it couldn’t be caused by the vaccine? None that I’m aware of.
They reject the hypothesis based on belief (because they are told it is safe), not data.
Henjin’s data
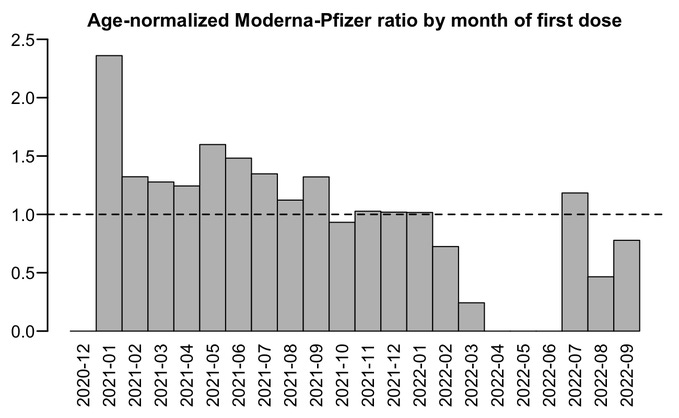
I love this quote:
“The plot below shows that even in late 2022, people got a Moderna vaccine for the first dose had much higher excess mortality than people who got a Pfizer vaccine for the first dose. If the difference in mortality would be because of vaccine deaths like Kirsch says, you'd expect the difference to be greatest in the first few weeks or months after vaccination and get weaker over time. But because the difference remains in place more than a year after vaccination, it rather seems to be caused by some confounding factors which I didn't adjust for here.”
I love the statement “If the difference in mortality would be because of vaccine deaths like Kirsch says, you'd expect the difference to be greatest in the first few weeks or months after vaccination and get weaker over time.”
No, that’s not how these vaccines operate. The mortality rates are elevated for many months, maybe years, after the shot. The time series analysis shows that.
But the most important part is that 6 months after all people prioritized due to comorbidities got their shots, the mortality difference was still there! How do they explain that? Well they don’t.
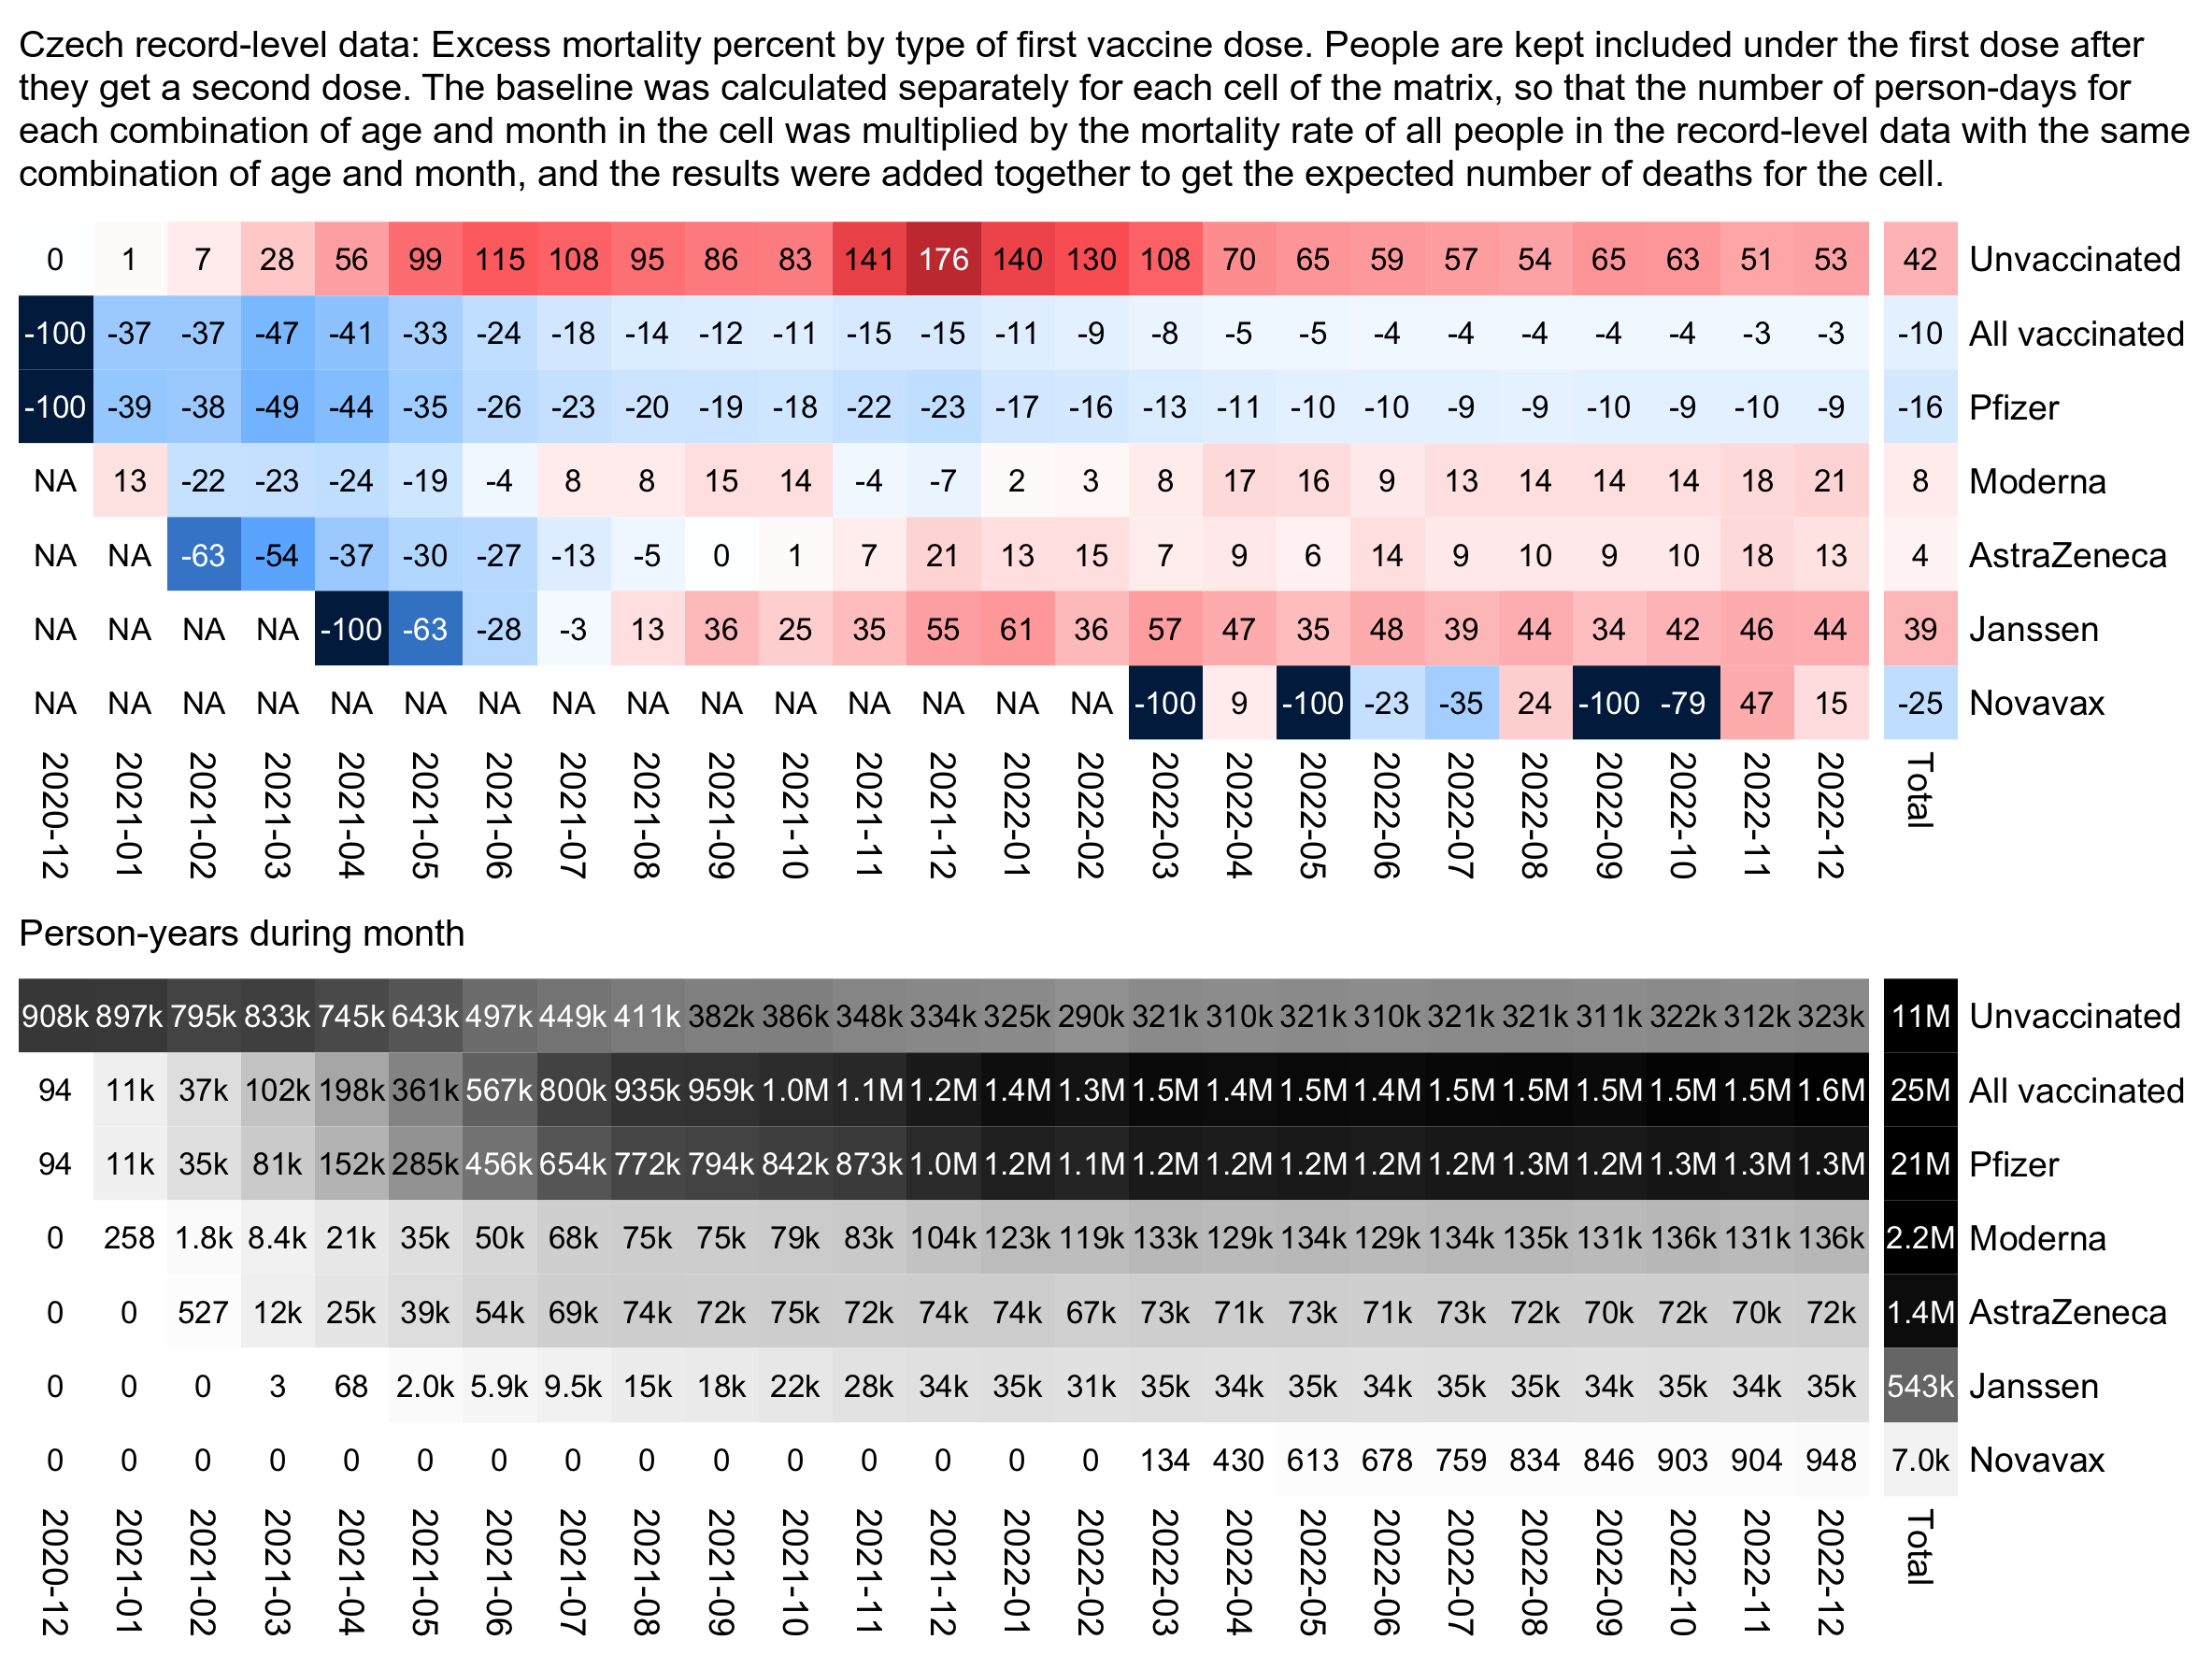 |
And even more damaging is this: AstraZeneca had 6.3X higher comorbidities than Janssen (see the mortality.xlsx spreadsheet in my repo or the image below taken from the spreadsheet), but nearly 10X lower excess mortality percentage from the chart above. So if vaccine deaths were driven by the comorbidity distribution percentage, how do we explain a 63X swing in the wrong direction??? So it’s simply ludicrous to make the assertion that higher comorbidities explain the effect. This one example shows that the comorbidities play an insignificant role in the mortality ratio of a vaccine.
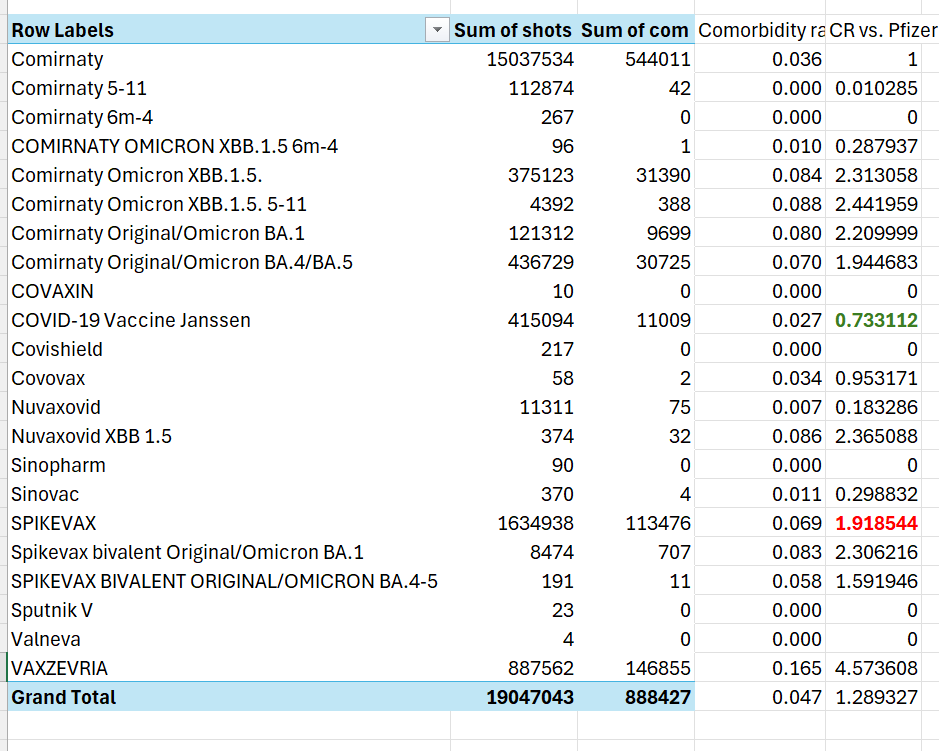 |
AstraZeneca (last line - VAXZEVRIA) has 6.3X higher comorbidities than Janssen, but 10X lower excess deaths per Henjin’s chart above (39/4). If comorbidities are driving the difference in mortality, how will they ever explain this 63X swing in the WRONG direction???
My favorite part is that he believes the COVID vaccines cannot cause anyone to die after a few months even though we have lots of stories of vax injured people who last years before dying from the shots.
I asked him for evidence for that belief and didn’t get an answer. Therefore, he’s simply unable to explain the data and chalks it up to a mysterious confounder as to the cause instead of admitting that the only explanation is the vaccine is killing people over time. Check this out:
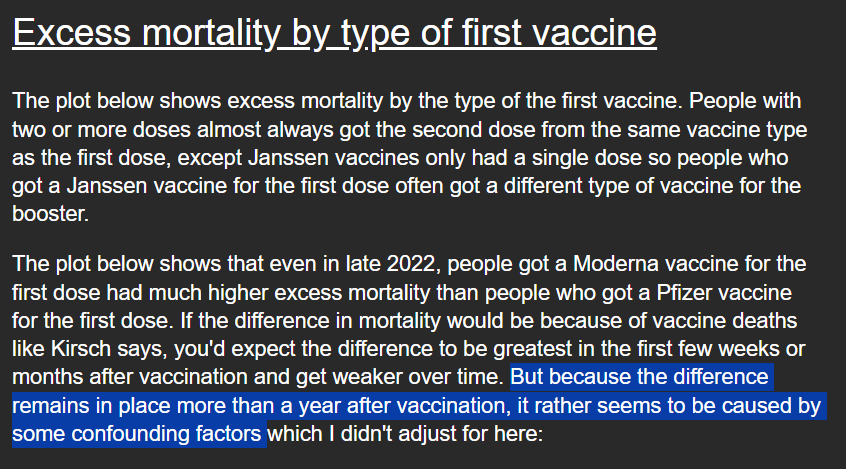 |
All this evidence dismissed on the basis of “some confounding factors”
I also asked UPenn Professor Jeffrey Morris why he doesn’t publish his own analysis of the Czech data showing that they are perfectly safe. He replied he doesn’t have time. Wow. The single best dataset to resolve one of the most important issues of our time, but he doesn’t have time to properly analyze it. But he has plenty of time to throw FUD on my analysis.
After I went blind in my right eye, I pleaded with him to call me to resolve the issues. He never called.
He also said my research isn’t valid because I don’t understand confounders. I’ve controlled for comorbidities and COVID being the cause. I asked him what other confounder can cause a 30% mortality increase other than the brand of an injectable? He never responded.
To date, I’m not aware of any other explanation that fits the data other than both vaccines are unsafe.
I think the key point is that all of the attacks failed to provide a credible alternative hypothesis. All the attackers failed to point out anything in the data that would preclude the vaccines from being deadly. The evidence just keeps stacking up but the belief system stops them admitting it.
Summary
The Czech Republic data seals the deal. There is simply no way to show how this data is consistent with the “safe and effective” narrative. The fact that there is a 30% increased mortality from the Moderna shot across all age groups during non-COVID can only be explained one way: the shots are deadly.
The best way to disprove I’m wrong is for all countries and states to publicly disclose their record level data just like the Czech Republic did.
They will never do that. And they’ll never analyze the Czech data to show it is safe. They want to distract your attention somewhere else. And that is precisely why we need to be like a dog on a bone on this data.
For example, if you want to know why Paul Offit refuses to look at the Czech data, why not ask him on his X account or his Substack? If you find out, let me know because he’s sure not willing to tell me!
If we don’t hold these people accountable, nobody will.
No comments:
Post a Comment